
Probability vs. Non-Probability Polling in 2024
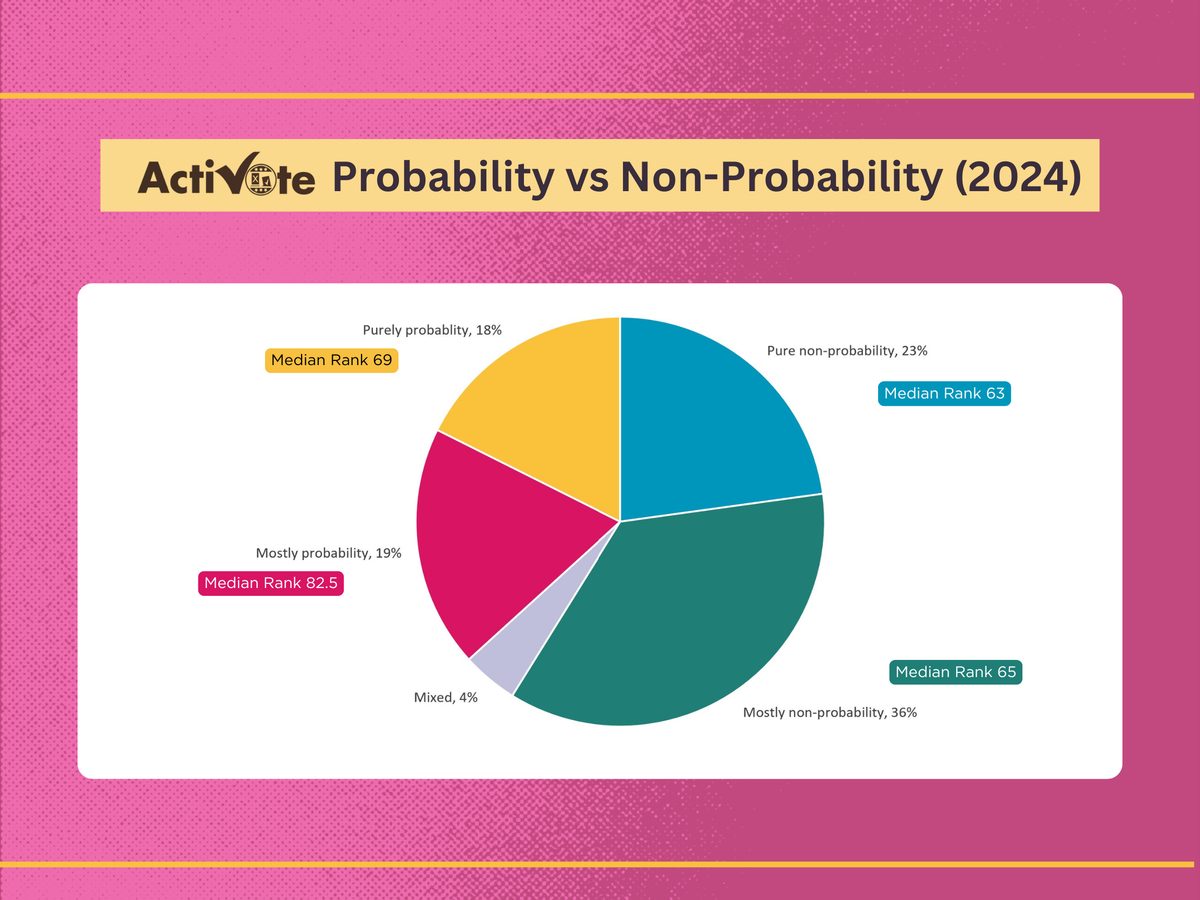
For years, a central question in public opinion research has been whether traditional probability sampling - the method long considered the scientific gold standard - outperforms non-probability sampling techniques in producing accurate results.
Quick Summary
- The 2024 ActiVote MVP rankings show that non-probability-leaning pollsters were especially strong at the very top of the leaderboard: the #1 pollster was non-probability, and no probability-leaning pollster reached the Top 10.
- Across the full field of 136 pollsters, the broad differences between methodology groups were much smaller. Pure probability and pure non-probability performed similarly overall, while the “mostly probability” category was the main (negative) outlier on average rank.
- Most broad differences were not statistically significant. The clearest statistical signal appears in the Top 10, where the non-probability surge was unlikely to be random under a simple no-relationship baseline.
- The practical takeaway for 2026 is not to judge polls by sampling methodology. Track record, transparency, weighting, and calibration matter much more than whether a poll begins from a probability or non-probability sample.
Probability sampling refers to surveys where each member of the target population has a known, non-zero chance of selection - often via random digit dialing (RDD), address-based sampling (ABS), or random draws from voter files. In the textbook version of this approach, random selection supports design-based inference: researchers can quantify sampling error (the “margin of error”) under the assumptions of the sampling design [17]. For generations, academic orthodoxy and major polling institutions treated this method as the undisputed “gold standard” of research.
Non-probability sampling, by contrast, includes opt-in online panels, digital “river” sampling (people who click on ads), text-to-web invitations, and app-based self-selected respondents. These approaches do not give every voter an equal chance of selection, so they rely heavily on statistical modeling - such as multilevel regression and post-stratification (MRP), quota weighting, and calibration to voter-file data or past election results [10, 11, 21] - to adjust the final estimates toward known population benchmarks [19].
For decades, academic and professional consensus, reflected in early AAPOR task-force reports [7], Pew Research Center guidelines [14, 18], and textbooks [20], favored probability methods as clearly superior. Popular polling aggregators often discounted or excluded non-probability polls on principle.
However, response rates for traditional telephone surveys have fallen into the low single digits (often 2-9%) [14, 15]. When a “probability” poll yields such low response rates, it loses much of its theoretical guarantee, as the small fraction who respond may not represent the whole and can introduce severe nonresponse bias [12, 13, 16].
At the same time, non-probability pollsters have dramatically improved their modeling capabilities. The prevailing sentiment today is pragmatic: execution, modeling quality, and transparency matter at least as much as the sampling label [6, 8, 9].
Methodological debates about coverage error and nonresponse bias can become abstract. Election polling has a rare advantage: on Election Day we observe a concrete benchmark - the actual vote totals - so we can directly compare pre-election estimates to real outcomes [2, 3, 4]. That does not make elections a perfect laboratory (opinions can shift late, and pollsters choose different races), but it makes them one of the clearest large-scale tests available for assessing practical performance.
To examine the current state of the art, we turn to the ActiVote Most Valuable Pollster (MVP) rankings [1]. This dataset evaluated 136 pollsters based on 1,349 polls released between October 7 and November 5, 2024. The scoring combines pinpoint accuracy in the final 30 days (adjusted for race difficulty) with prolificacy across national, state, and district races. Importantly, the rankings are cycle-specific and forward-looking - no historical reputation is baked in - making them an especially clean lens for comparing methodologies in one recent, high-visibility election.
Understanding the Data Landscape
Before diving into the results, it helps to define the methodology classification used in this analysis. Each firm was assigned a rating from 1 to 5 based on its publicly described approach to sampling and fieldwork. This rating is not a measure of “quality” by itself; it is a structured way to categorize methodology, and some categories - especially hybrids - can include a variety of designs. (Note: a complete list of all 136 pollsters and their specific methodology descriptions can be found in the Appendix at the end of this article.)
| Rating | Category | Count | Share (%) | Examples of Methodology |
| 1 | Pure non-probability | 31 | 22.8% | Opt-in panels, web intercepts, heavy modeling |
| 2 | Mostly non-probability | 49 | 36.0% | Heavy automated phone/online panel mixes |
| 3 | Mixed/unsure | 6 | 4.4% | Hybrid approaches |
| 4 | Mostly probability | 26 | 19.1% | Live phone mixed with some text-to-web |
| 5 | Pure probability | 24 | 17.6% | Traditional RDD, live-caller voter file |
When analyzing the distribution of these methods, a clear baseline emerges. Non-probability-leaning pollsters (ratings 1 and 2) are the majority, accounting for 80 out of the 136 total pollsters, or 58.8% of the dataset. Conversely, probability-leaning pollsters (ratings 4 and 5) account for 50 firms, or 36.8%. Just 6 pollsters (4.4%) fall into the strictly mixed rating 3. Because non-probability approaches are the more common baseline in the dataset, any analysis must examine over- or under-representation relative to these shares rather than raw counts alone. Lower MVP rank numbers indicate better performance.
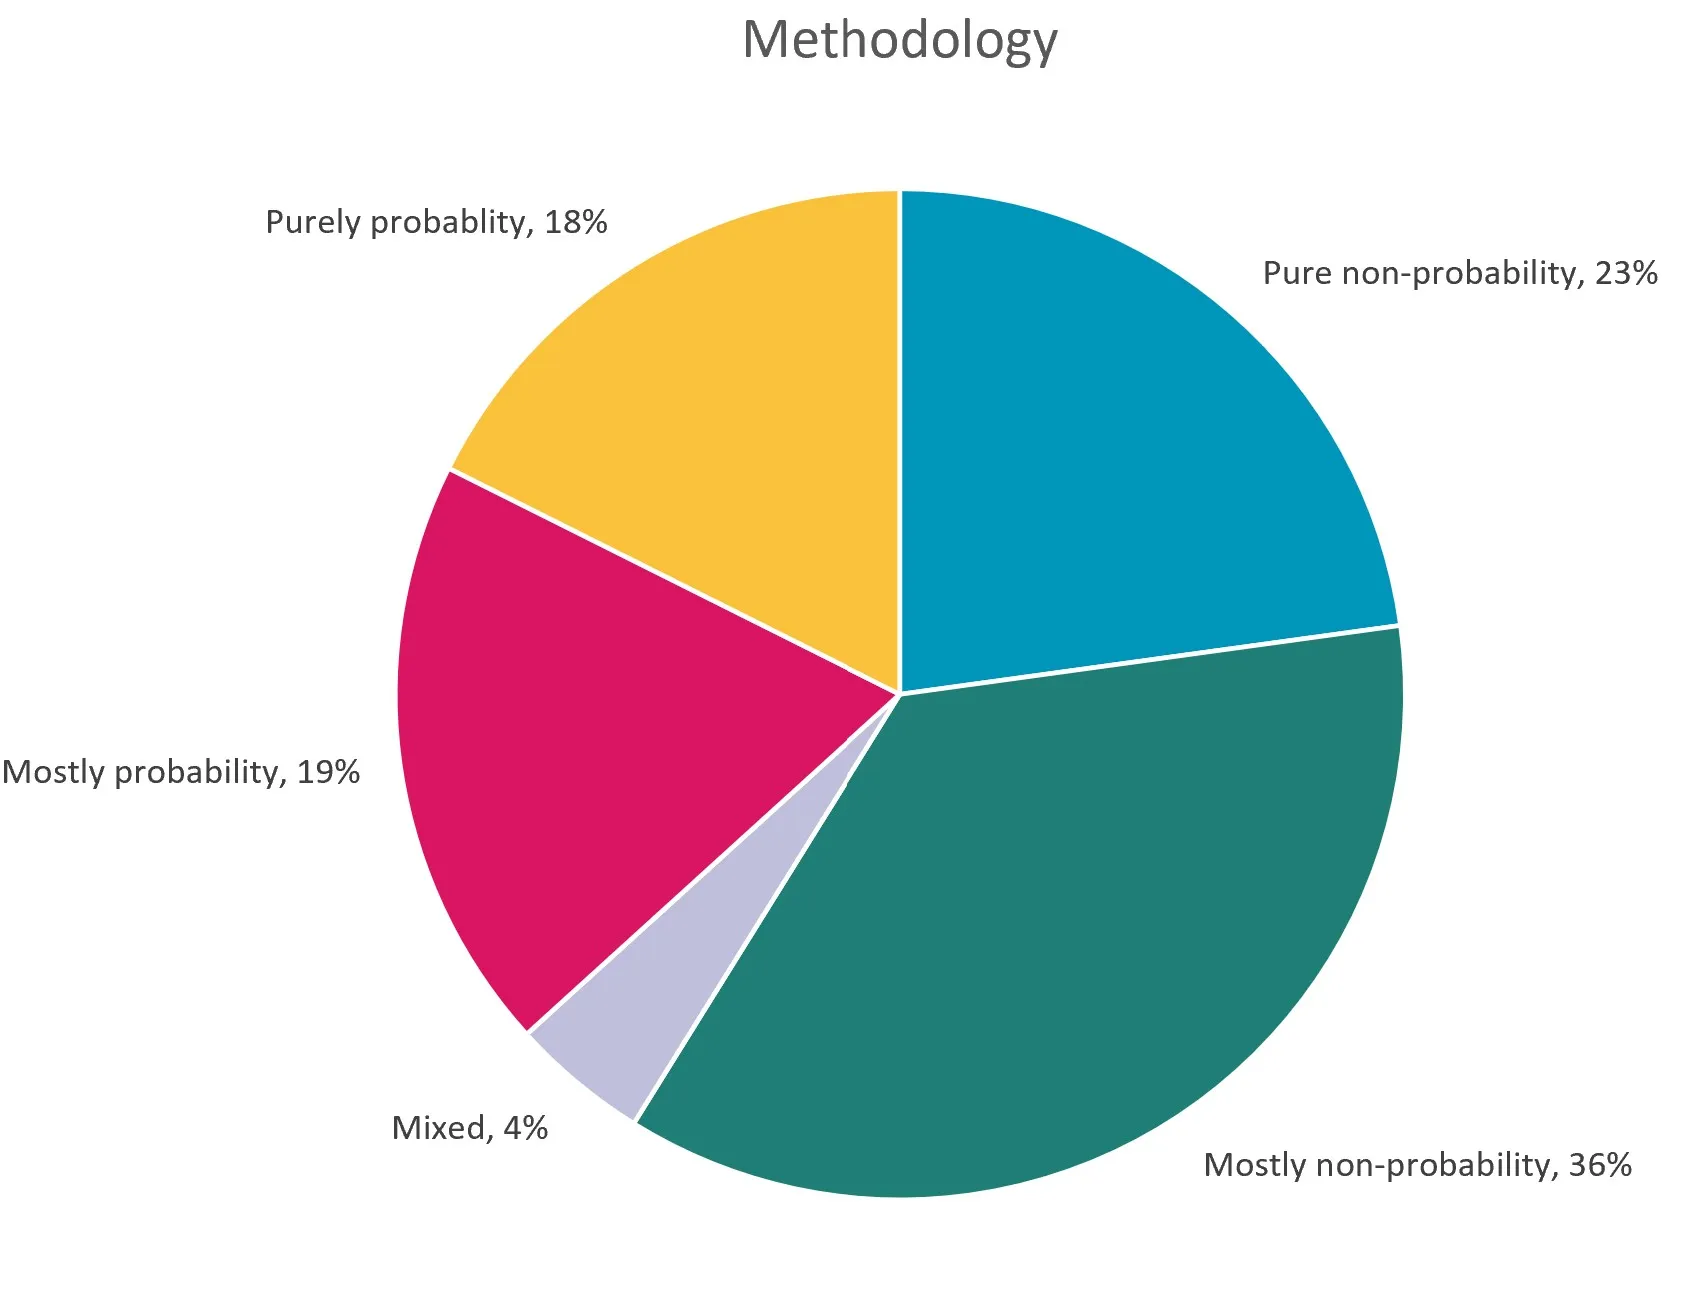
Figure 1. Overall distribution of the 136 pollsters across the five methodology categories.
Five Key Matchups in the 2024 Data
To make the leaderboard digestible without losing substance, we focus on five comparisons that are both intuitive for general readers and informative for technical readers.
1. The Absolute Top of the Leaderboard
The #1 spot naturally draws attention in any ranking. In the 2024 cycle, the number one overall rank belongs to AtlasIntel, a firm rated as a 1 (pure non-probability) that utilizes river sampling and MRP weighting. By contrast, the highest-ranking pure probability pollster (rating 5) is Suffolk University, appearing at #12. Notably, there are zero probability-leaning pollsters (ratings 4 or 5) in the Top 10.
The full Top 10 list, with each pollster’s numeric rating and the corresponding methodology category, is:
| Rank | Pollster | Rating | Methodology Category |
| 1 | AtlasIntel | 1 | Pure non-probability |
| 2 | InsiderAdvantage | 2 | Mostly non-probability |
| 3 | OnMessage Inc. | 3 | Mixed/unsure |
| 4 | Rasmussen Reports | 1 | Pure non-probability |
| 5 | Trafalgar Group | 1 | Pure non-probability |
| 6 | Patriot Polling | 2 | Mostly non-probability |
| 7 | Emerson College Polling | 2 | Mostly non-probability |
| 8 | ActiVote | 1 | Pure non-probability |
| 9 | Fabrizio/McLaughlin | 3 | Mixed/unsure |
| 10 | TIPP Insights | 2 | Mostly non-probability |
2. The Elite Tier (Top 20)
Looking beyond the Top 10, the Top 20 provides a broader “elite” tier. In the Top 20, non-probability-leaning pollsters (ratings 1-2) occupy 14 of 20 slots (70%), compared with their 58.8% baseline share in the full dataset - an over-representation. By rating, the Top 20 contains 7 rated “1,” 7 rated “2,” 2 rated “3,” 1 rated “4,” and 3 rated “5.”
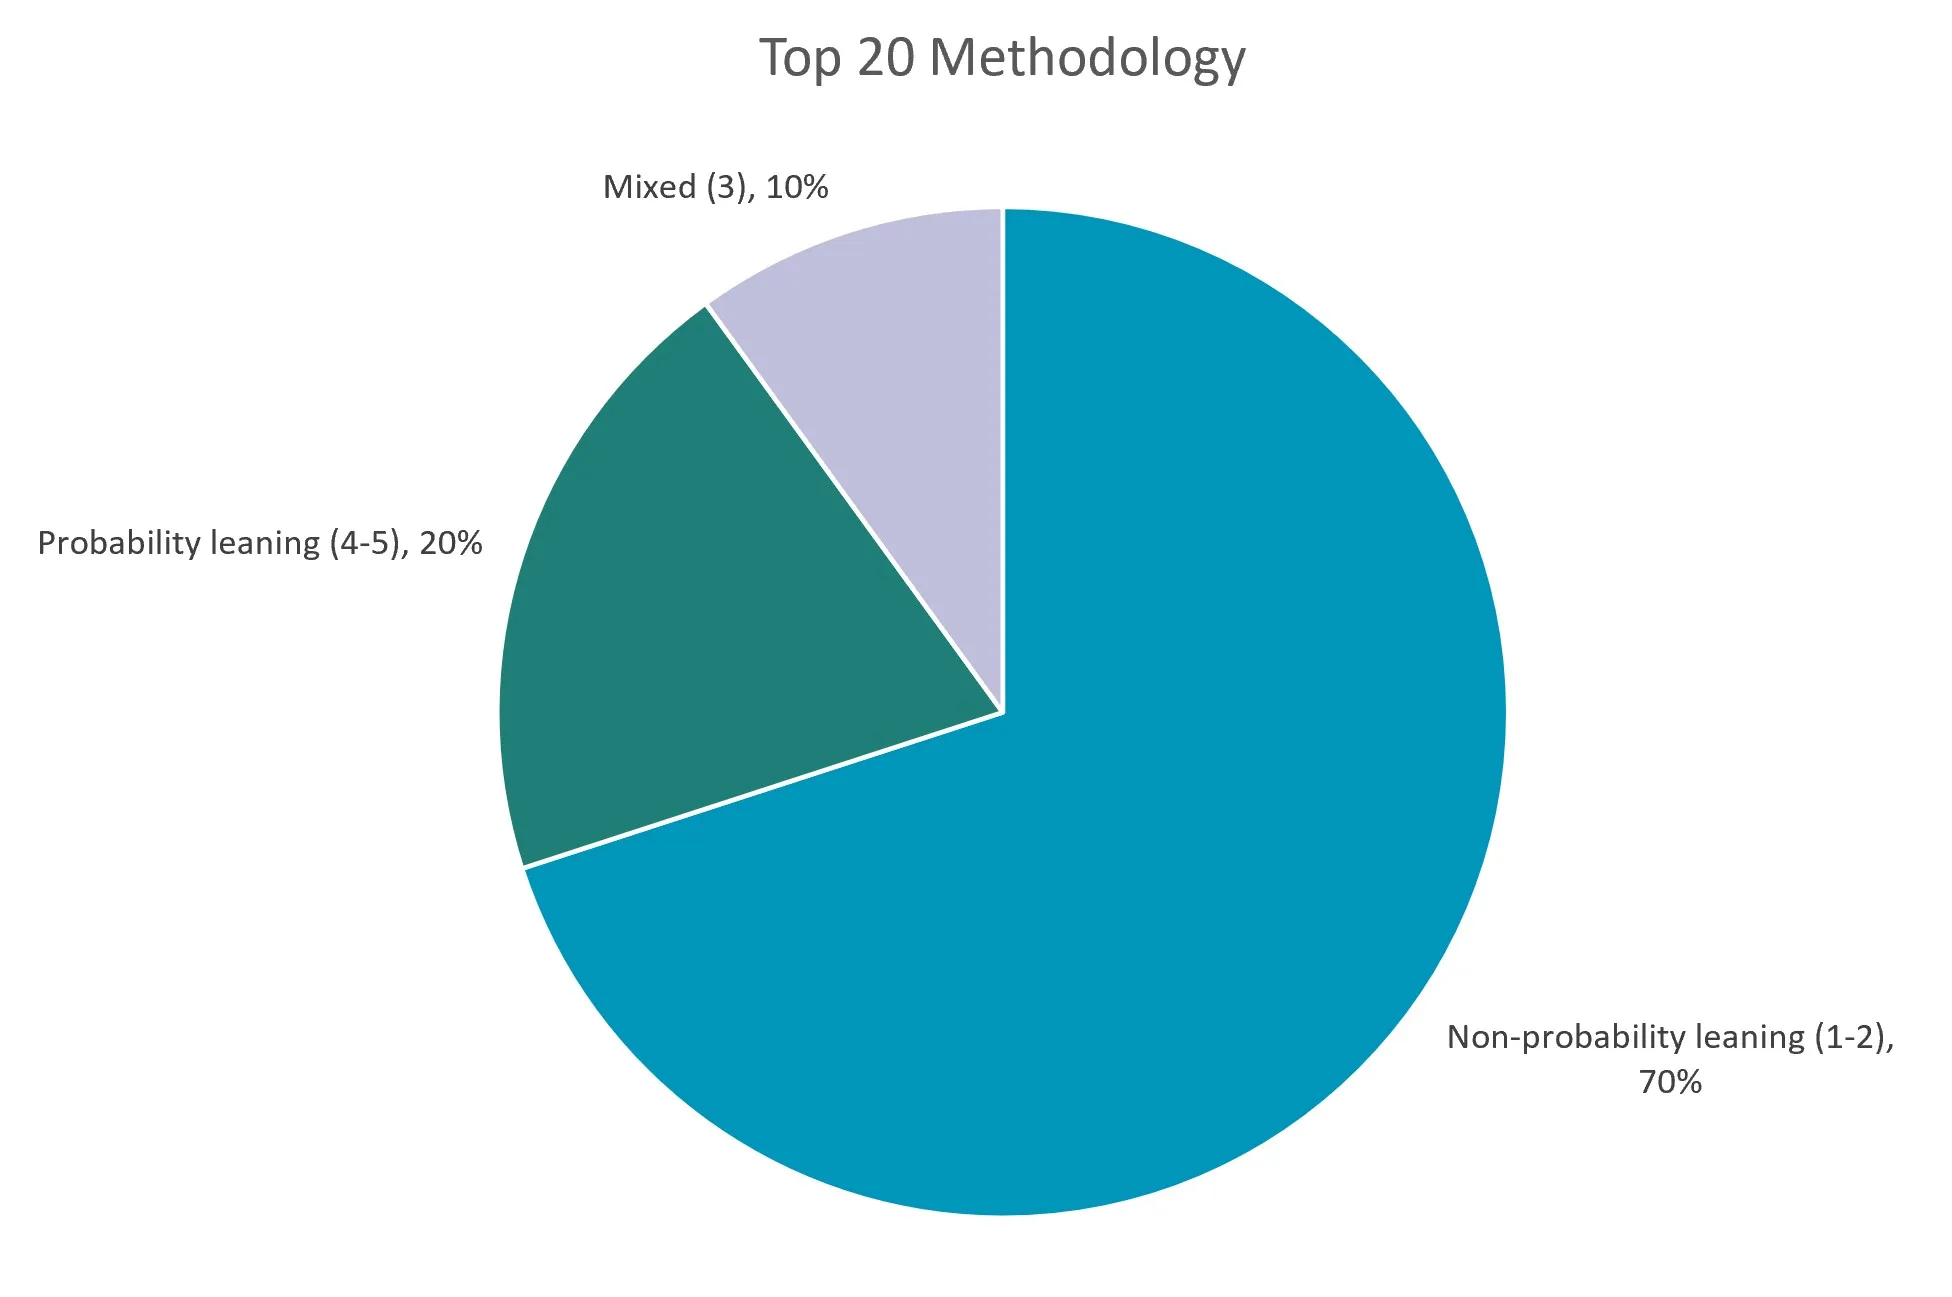
Figure 2. Composition of the Top 20 using the three broad methodology groupings.
3. Overall Performance Across All Five Methodology Groups
Looking at average and median ranks across the entire field of 136 pollsters gives a complete picture that includes both stars and laggards.
| Rating | Description | Count | Mean Rank (lower = better) | Median Rank |
| 1 | Pure non-probability | 31 | 67.5 | 63.0 |
| 2 | Mostly non-probability | 49 | 66.2 | 65.0 |
| 3 | Mixed/unsure | 6 | 66.0 | 64.0 |
| 4 | Mostly probability | 26 | 76.8 | 82.5 |
| 5 | Pure probability | 24 | 66.2 | 69.0 |
Ratings 1, 2, 3, and 5 cluster tightly in the mid-60s. Rating 4 (“mostly probability”) stands out as the clear outlier with the worst mean and median performance. This suggests that hybrid approaches attempting to blend probability frames with substantial non-probability elements may, in this cycle, have combined the drawbacks of both worlds without consistent gains.
4. Performance in the Top 50 Tier
The Top 50 contains the pollsters whose results are most visible to the public and most likely to influence media coverage and campaign strategy. Non-probability-leaning pollsters (Ratings 1-2) occupy 30 of the 50 spots (60%), slightly above their 58.8% baseline share. Probability-leaning pollsters (Ratings 4-5) occupy 18 spots (36%), with the 2 mixed pollsters filling the remainder. The non-probability edge that is very pronounced in the Top 10 and Top 20 is still present but noticeably more moderate once we reach the broader group of high-performing pollsters.
5. Representation in the Bottom Half (Ranks 69-136)
To check whether any methodology is disproportionately likely to produce poor results, we examined the bottom 68 pollsters (the lower 50% of the ranking). In the grouped comparison, non-probability-leaning pollsters (ratings 1-2) account for 39 of the 66 pollsters once the two mixed firms are set aside (59.1%), essentially matching their 58.8% baseline share. Rating 4 (“mostly probability”) is modestly over-represented at 15 pollsters (22.1% vs. 19.1% baseline), while pure probability (rating 5) accounts for 12 pollsters (17.6%), essentially matching its overall share.
Within this bottom half, the average rank for non-probability-leaning groups (ratings 1-2 only) is 102.0 (median 102.0); for probability-leaning groups (ratings 4-5 only), it is 101.4 (median 99.0). This distribution reinforces that no methodology is immune to misses and that non-probability approaches are not clustered among the weakest performers.
The Statistical Reality Check
It is tempting to look at the complete absence of probability pollsters in the Top 10 and declare traditional probability polling obsolete. However, a rigorous statistical interpretation provides a more nuanced picture of the industry.
For readers less familiar with statistics: when analysts test “significance,” they are asking whether an observed pattern is unlikely under a simple baseline where there is no relationship between methodology and outcomes. When comparing overall rank distributions across all five methodology groups, a Kruskal-Wallis test yields p ≈ 0.837, which provides no evidence of a systematic difference across the five categories in the full dataset. A Mann-Whitney U test comparing non-probability-leaning pollsters (Ratings 1-2) against probability-leaning pollsters (Ratings 4-5) yields p ≈ 0.480, also not statistically significant. Comparing the pure extremes (Rating 1 vs. Rating 5) produces p = 1.00, indicating that their overall rank distributions are not distinguishable in this dataset (see also Yeager et al., 2011 [22] for an earlier large-scale comparison).
In other words, while non-probability-leaning approaches are prominent at the very top of the leaderboard, the broader differences across the full 136-pollster distribution are not statistically significant. That is consistent with an industry in which performance depends heavily on execution details - weighting, likely-voter modeling, and calibration - not only on the sampling label.
There is, however, one area where the statistics signal a clear shift. A Fisher exact test analyzing specifically who made it into the Top 10 (comparing Groups 1-2 against Groups 4-5) returns a p-value of 0.023, which is statistically significant. This supports the conclusion that the surge of non-probability polling at the very peak of the leaderboard is a meaningful trend, unlikely to have occurred under a baseline assumption of no relationship. The dominance at the absolute top is real, likely driven by highly effective, firm-specific modeling techniques rather than a universal superiority of all non-probability surveys.
A parallel Fisher exact test on Top-20 membership (Groups 1-2 vs. Groups 4-5) returns a two-tailed p-value of approximately 0.191 - which is not statistically significant at conventional levels. This indicates that the non-probability advantage is most pronounced at the absolute peak and gradually moderates as we move further down the leaderboard. These p-values are best read as exploratory signals within one election cycle rather than definitive proof of a universal effect.
Looking Ahead: Interpreting Polls for the 2026 Midterms
The 2024 ActiVote MVP data provide a vital roadmap for how ordinary voters, journalists, and campaign professionals should interpret polling data heading into the 2026 midterms. First and foremost, it is time to retire the dogma that assigns the phrase “gold standard” exclusively to traditional, probability-based, live-caller polling. Labels like “RDD live phone” do not automatically confer reliability. The 2024 data suggest that river sampling, opt-in panels, and heavy data modeling are not intrinsically inferior; in the modern era of low response rates, this analysis shows that they can be superior at the elite level.
Going forward, sampling still matters, but it increasingly interacts with adjustment - weighting, turnout modeling, validation against voter files, and other calibration steps. Whether a poll uses live calling, SMS-to-web, panels, or river recruitment, modern election polling is fundamentally a process of statistical estimation under real-world constraints, and the quality of that estimation is not captured by a single label.
When judging polling quality in upcoming cycles, treat a pollster’s stated methodology as useful context, but treat their recent, demonstrated election-cycle track record as the primary verdict. The most defensible standard is radical transparency in weighting, turnout modeling, and likely-voter screens [5], regardless of sampling frame, combined with repeatable performance on independent scorecards.
The 2024 data do not declare a permanent winner in the probability versus non-probability debate. Instead, they illustrate a polling industry that has become more pragmatic and results-oriented. Non-probability approaches, when executed with sophisticated modeling, showed they can compete - and sometimes lead - at the highest level. Traditional probability methods continue to deliver solid results for many firms. The real differentiator is the skill with which any pollster turns raw responses into calibrated estimates of the electorate.
As we head into the 2026 midterms, the most reliable guide will be empirical performance in recent cycles, combined with clear methodological disclosure. The era of relying on labels is giving way to an era of results - and that is ultimately healthy for both the polling industry and the public that depends on it.
References
[1] ActiVote. (2025). 2024 Most Valuable Pollster (MVP) Rankings. ActiVote.
[4] American Association for Public Opinion Research (AAPOR). (2025). 2024 election polling review.
[5] American Association for Public Opinion Research (AAPOR). (n.d.). Transparency Initiative.
[6] Bailey, M. A. (2023). The death of the random-sampling paradigm? Harvard Data Science Review, 5(3).
[17] Pew Research Center. (2016). Understanding the margin of error in election polls.
[18] Pew Research Center. (2019). For weighting online opt-in samples, what matters most?
[19] Rivers, D. (2006/2007). Sample matching: Representative sampling from internet panels.
[22] Yeager, D. S., et al. (2011). Comparing the accuracy of RDD telephone surveys and internet surveys conducted with probability and non-probability samples. Public Opinion Quarterly, 75(4), 709-747. View online
Appendix: MVP Pollster Methodology Descriptions
Disclaimer on Methodology Ratings
The 1-5 methodology ratings assigned to each of the 136 pollsters are based on the most detailed public descriptions of their sampling frames, recruitment methods, fieldwork modes, and adjustment procedures available as of early 2026. We made every reasonable effort to locate accurate information from pollster websites, methodological appendices, white papers, press releases, and other disclosures. However, transparency levels vary widely across firms, and some descriptions are brief, incomplete, or subject to change. Classification of hybrid or mixed-mode approaches requires interpretive judgment. Reasonable experts may reach different conclusions about how to categorize the same pollster depending on the weight given to various elements (for example, the presence of a probability frame versus the extent of non-probability supplementation). These ratings are therefore best understood as a good-faith, informed interpretive framework designed to facilitate analysis, not as an official or indisputable judgment. Readers are encouraged to consult the original methodology descriptions provided in this appendix and to form their own assessments.
| Ranking | Pollster Name | Rating | Description |
| 1 | AtlasIntel | 1 | RDR geolocated web intercepts via digital ads/banners; non-probability river sampling with heavy post-stratification and big data modeling. |
| 2 | InsiderAdvantage | 2 | Mixed-mode utilizing IVR automated phone and opt-in online panels/text-to-web from voter files; weighted for likely voters with partisan screens. |
| 3 | OnMessage Inc. | 3 | Conservative-aligned firm using voter-file SMS-to-web and online interviewing; weighted to demographics/partisanship. |
| 4 | Rasmussen Reports | 1 | Automated telephone (IVR) and opt-in online panels; non-probability mixed-mode weighted to specific population targets and partisan demographics. |
| 5 | Trafalgar Group | 1 | Non-probability multi-mode using IVR, SMS-to-web, and online panels; utilizes proprietary social desirability and low-propensity voter modeling. |
| 6 | Patriot Polling | 2 | Student-run mixed-mode using telephone cold calling alongside non-probability online intercepts and panels; utilizes geo-targeting and weighting. |
| 7 | Emerson College Polling | 2 | Hybrid non-probability leaning approach mixing landline IVR, SMS-to-web, and online panels; weighted heavily by education and 2020 recalled vote. |
| 8 | ActiVote | 1 | Pure non-probability app-based panel relying on self-selected mobile app users; results are heavily modeled and weighted against voter file data. |
| 9 | Fabrizio/McLaughlin | 3 | Republican-aligned campaign polling utilizing a hybrid of voter-file based live telephone probability samples combined with opt-in online panels. |
| 10 | TIPP Insights | 2 | Transitioned heavily to non-probability online panels (TechnoMetrica/Lucid) with some traditional RDD telephone supplementation and quota weighting. |
| 11 | Redfield & Wilton Strategies | 1 | Purely non-probability opt-in online panel polling relying entirely on quota sampling and sophisticated MRP (Multilevel Regression) weighting. |
| 12 | Suffolk University | 5 | Gold-standard probability polling utilizing traditional RDD and voter files for live-interviewer landline and cell phone PPS sampling. |
| 13 | Mitchell | 2 | Michigan-focused mixed-mode approach relying heavily on registered-voter text-to-web (SurveyMonkey), supplemented by IVR and online panels. |
| 14 | Quantus Insights | 2 | Non-probability mixed-mode approach combining automated phone (IVR) and digital river/online intercept sampling with AI-driven calibration. |
| 15 | HarrisX | 1 | Pure non-probability approach using high-frequency opt-in online sampling and validated web panels with dynamic recruitment and demographic tracking. |
| 16 | Echelon Insights | 2 | Multi-mode approach targeting verified voter files but heavily relying on non-probability online panels, SMS-to-web, and automated IVR collection. |
| 17 | SoCal Strategies | 1 | Strict non-probability digital sampling utilizing the Pollfish opt-in mobile app panel and SMS-to-web recruitment with geo-targeted quotas. |
| 18 | Siena/NYT | 5 | High-quality probability polling using random samples from voter files with live telephone interviewing, utilizing 2020 recalled vote weighting. |
| 19 | Marquette Law School | 5 | Rigorous hybrid probability sampling combining registered voter lists with the SSRS probability-based panel, utilizing live phone and web modes. |
| 20 | Beacon/Shaw | 4 | Bipartisan probability methodology using random selection from voter files with live phone interviews and some text-to-web online completion. |
| 21 | The Washington Post | 5 | Probability-based approach blending traditional live RDD phone interviews with probability-recruited panels like AmeriSpeak and text-to-web. |
| 22 | East Carolina University | 4 | Probability-based frame drawing random samples of registered voters from voter files, collected via IVR to landlines and SMS-to-web to cells. |
| 23 | Hart/POS | 5 | Professional probability polling leaning heavily on traditional live-interviewer RDD telephone sampling, utilized for major media balanced surveys. |
| 24 | Research & Polling | 5 | Strict probability methodology utilizing traditional live interviewer calls sourced from RDD and voter files, primarily focused on the Southwest. |
| 25 | U. New Hampshire | 4 | Academic probability-based sampling primarily using live phone interviews, supplemented scientifically by mail and proprietary online panels. |
| 26 | RMG Research | 1 | Pure non-probability methodology managed by Scott Rasmussen, utilizing opt-in online panels of registered voters with quotas and light weighting. |
| 27 | Cygnal | 2 | Republican-aligned mixed-mode combining automated IVR, SMS-to-web, and opt-in online panels, heavily reliant on big data turnout modeling. |
| 28 | Big Data Poll | 2 | Non-probability mixed-mode utilizing opt-in online panel surveys integrated with voter files, supplemented by IVR and peer-to-peer (P2P) texting. |
| 29 | Morning Consult | 1 | Massive non-probability opt-in online panel leveraging immense sample sizes, quota sampling, daily tracking, and sophisticated MRP weighting. |
| 30 | University of Maryland/WaPo | 4 | Probability-based methodology combining Maryland voter-file random samples via live phone and SMS with national probability panels like AmeriSpeak. |
| 31 | Torchlight Strategies | 2 | Republican-aligned non-probability campaign polling ecosystem heavily relying on automated IVR phone calls and opt-in online web panels. |
| 32 | PPP | 2 | Historically IVR-heavy automated phone methodology from voter files, now frequently supplemented with non-probability opt-in online web panels. |
| 33 | Marist College | 5 | Top-tier probability sampling using dual-frame RDD for landlines and cells with live interviewers, occasionally adding text/web in a prob frame. |
| 34 | Research Co. | 1 | Pure non-probability methodology relying strictly on opt-in online sampling via platforms like Lucid, calibrated with standard demographic weights. |
| 35 | SurveyUSA | 2 | Project-optimized mixed-mode approach blending automated IVR, live phone for cell-only households, and non-probability opt-in online panels. |
| 36 | FL Atlantic U./Mainstreet Research | 2 | Non-probability hybrid approach blending automated IVR to landline segments with opt-in online panels and text-to-web for younger demographics. |
| 37 | YouGov | 1 | Non-probability opt-in online panel utilizing sophisticated sample matching to population frames, emphasizing 2020 recalled vote weighting. |
| 38 | WaPo/George Mason University | 4 | High-quality probability mixed-mode combining live-caller phone interviews with SMS-to-web and rigorous probability-based panels like AmeriSpeak. |
| 39 | Quinnipiac University | 5 | Gold-standard probability polling strictly using dual-frame RDD telephone surveys with live interviewers for both cell phones and landlines. |
| 40 | UC Berkeley | 4 | Probability Registration-Based Sampling recruiting respondents via email/text invitations sent to a random selection of the official voter file. |
| 41 | J.L. Partners | 2 | Campaign-style mixed-mode leaning non-probability, combining SMS-to-web, live phone, and opt-in online panels with partisan/demographic weighting. |
| 42 | Chism Strategies | 2 | Democratic-aligned campaign polling utilizing a mixed-mode approach that combines automated IVR, text-to-web, and non-probability online panels. |
| 43 | St. Anselm | 4 | Academic-backed probability polling maintaining dual-frame RDD landline and cell phone samples with live interviewers, plus some online components. |
| 44 | WPAi | 2 | Republican-aligned data firm relying on a multi-mode mix of live telephone, SMS-to-web, and non-probability online panels for turnout modeling. |
| 45 | Axis Research | 2 | Campaign-style mixed methodology utilizing live telephone interviews heavily supplemented by non-probability online sampling and text-to-web links. |
| 46 | Fabrizio/Impact | 2 | Bipartisan mixed-mode collaboration combining traditional live telephone interviews with a heavy reliance on non-probability online panel surveys. |
| 47 | Monmouth | 5 | Rigorous probability national random sampling combining live RDD and list-based live interviews with text-to-web surveys via random invitations. |
| 48 | Susquehanna | 4 | Probability-leaning methodology primarily utilizing live interviewer calling for landline and cell phones, with limited mixed-mode survey collection. |
| 49 | Noble Predictive Insights | 2 | Non-probability leaning mixed-mode methodology combining live telephone calls, automated IVR, and heavily weighted opt-in online survey panels. |
| 50 | CNN/SSRS | 4 | Robust probability-based approach leveraging the ABS-recruited SSRS Opinion Panel combined with voter-file RDD live phone and online interviewing. |
| 51 | The Citadel | 4 | Academic probability-based state polling traditionally relying on live telephone interviews, supplemented by some online panel integration in 2024. |
| 52 | Fabrizio/GBAO | 2 | Bipartisan strategy methodology utilizing a mixed-mode approach of live telephone calls alongside non-probability opt-in online panel interviews. |
| 53 | Ipsos | 4 | Primarily utilizes the high-quality probability-based, ABS-recruited KnowledgePanel, occasionally supplemented by non-probability online samples. |
| 54 | HarrisX/Harris Poll | 1 | Entirely non-probability approach relying on opt-in online panel sampling and web intercepts, adjusted using standard demographic quota weighting. |
| 55 | UMass Lowell/YouGov | 1 | Academic collaboration utilizing YouGov’s non-probability matched-panel methodology, sampling from an opt-in panel to simulate a population frame. |
| 56 | CES / YouGov | 1 | The Cooperative Election Study relies on YouGov's massive non-probability opt-in panel platform, employing sample matching and advanced MRP modeling. |
| 57 | National Public Affairs | 2 | Non-probability mixed-mode methodology primarily utilizing automated telephone calls (IVR) combined with opt-in online web panels and quotas. |
| 58 | Kaplan Strategies | 2 | Non-probability approach blending automated phone surveys (IVR), SMS-to-web, and opt-in online panels, heavily reliant on post-stratification. |
| 59 | MSU - Billings | 5 | Traditional probability sampling utilizing dual-frame RDD live interviewer phone calls for academic regional and state-level political polling. |
| 60 | Guidant Polling and Strategy | 3 | Conservative-aligned mixed-mode polling utilizing live cell phones, text-to-web, and automated IVR, drawing randomly from state voter files. |
| 61 | Keating Research | 2 | Democratic-aligned mixed-mode methodology blending live phone interviews, automated IVR, and non-probability opt-in online panels via SMS-to-web. |
| 62 | Embold Research | 1 | Pure non-probability digital river sampling utilizing dynamic online ad recruitment to build custom intercepts with proprietary AI-driven weighting. |
| 63 | Data for Progress | 1 | Progressive non-probability methodology relying on SMS text-to-web and opt-in web panels, featuring heavy MRP weighting on education and past vote. |
| 64 | Ragnar Research Partners | 2 | Republican-aligned mixed-mode approach heavily utilizing automated IVR, SMS-to-web links, and non-probability online panels for campaign polling. |
| 65 | North Star Opinion Research | 2 | Mixed-mode methodology combining traditional live telephone interviews with non-probability online panel sampling, balanced via MRP weighting models. |
| 66 | Glengariff Group Inc. | 5 | Regional probability polling firmly rooted in traditional live interviewer telephone calls drawn from verified voter-file samples in the Midwest. |
| 67 | Garin Hart Yang | 5 | Democratic-aligned probability polling relying exclusively on traditional live interviewer calls, drawing random samples directly from voter files. |
| 68 | Roanoke College | 3 | Hybrid mixed-mode: blends random phone/text (dual-frame) recruitment with a proprietary online panel (Cint), weighted to targets. |
| 69 | Alaska Survey Research | 2 | State-focused mixed methodology combining traditional live telephone interviews with heavy reliance on non-probability opt-in online web panels. |
| 70 | Focaldata | 1 | Non-probability online polling relying entirely on digital opt-in samples, corrected using complex Multilevel Regression and Post-stratification. |
| 71 | Franklin and Marshall College | 5 | Elite academic probability polling utilizing dual-frame RDD and random voter-file based live interviewer calling, focused heavily on Pennsylvania. |
| 72 | Victory Insights | 2 | Non-probability approach focusing on digital river recruitment, web intercepts, and automated IVR with geographic targeting and quota weighting. |
| 73 | DCCC Targeting Team | 4 | Internal Democratic probability modeling utilizing Registration-Based Sampling from voter files via SMS, live phone, and controlled online modes. |
| 74 | Data Orbital | 2 | Republican-aligned mixed-mode polling combining voter-file targeted automated IVR, live telephone calls, and non-probability opt-in online panels. |
| 75 | MassINC Polling Group | 4 | Progressive-leaning probability mixed-mode approach utilizing live phone interviews and SMS-to-web samples drawn directly from official voter lists. |
| 76 | ABC News/Ipsos | 5 | High-tier probability polling leveraging Address-Based Sampling (ABS) via the rigorously recruited SSRS Opinion Panel and Ipsos KnowledgePanel. |
| 77 | Change Research | 1 | Strict non-probability digital river sampling utilizing dynamic online ad recruitment and text messaging, applying advanced MRP weighting models. |
| 78 | Schoen Cooperman | 2 | Strategy-focused mixed methodology combining live telephone interviews from voter files alongside non-probability opt-in online panel respondents. |
| 79 | Bullfinch | 2 | Modern mixed-mode strategy polling utilizing automated IVR, SMS-to-web, and non-probability online panels matched to voter file demographics. |
| 80 | Siena | 5 | Premier probability polling using random selection from voter files, live telephone interviews, and sophisticated likely-voter turnout modeling. |
| 81 | U. Georgia SPIA | 5 | Academic probability polling anchored in dual-frame RDD for landlines and cells, utilizing traditional live interviewer phone calls. |
| 82 | Concord Public Opinion Partners | 2 | Non-probability mixed-mode utilizing IVR automated calls and opt-in online panels/web surveys for Republican-aligned campaign clients. |
| 83 | U. North Florida | 5 | Pure probability academic polling utilizing high-quality dual-frame RDD for live-interviewer landline and cell phone sampling. |
| 84 | American Pulse | 2 | Non-probability approach relying entirely on digital river sampling and web intercepts, targeting respondents geographically without a fixed panel. |
| 85 | co/efficient | 2 | Non-probability mixed-mode blending automated IVR phone calls with digital river SMS-to-web sampling and AI-driven post-stratification. |
| 86 | Praecones Analytica | 2 | Pure non-probability mixed-mode methodology combining automated IVR and SMS-to-web surveys with opt-in online web panel sampling. |
| 87 | MRG (Marketing Resource Group) | 2 | Michigan-focused mixed methodology combining automated IVR, live phone, and opt-in online panels, heavily leaning on non-probability frames. |
| 88 | Mason-Dixon | 5 | Rigorous probability polling relying almost exclusively on traditional RDD and voter-file matched dual-frame live interviewer phone calls. |
| 89 | University of Maryland/YouGov | 1 | Non-probability matched-panel methodology utilizing YouGov's massive opt-in online panel framework to simulate population demographics via MRP. |
| 90 | Tarrance | 4 | Republican-aligned probability-leaning mixed-mode utilizing live interviewer calls and IVR drawn directly from voter files. |
| 91 | Christopher Newport U. | 5 | High-quality academic probability polling anchored securely in traditional RDD and voter-file based live interviewer telephone calls. |
| 92 | Normington, Petts & Associates | 2 | Democratic-aligned mixed-mode methodology combining traditional live telephone interviews with supplemental non-probability online sampling. |
| 93 | Muhlenberg | 5 | Top-tier probability sampling relying purely on traditional dual-frame RDD for live interviewer landline and cell phone calls in Pennsylvania. |
| 94 | Bowling Green State U./YouGov | 1 | Academic collaboration using YouGov's non-probability matched-panel methodology, drawing samples entirely from opt-in online platforms. |
| 95 | Elway | 4 | State-level probability methodology relying heavily on live interviewer calling drawn directly from voter files or RDD frames in Washington. |
| 96 | Dartmouth Poll | 4 | Academic probability-leaning methodology blending live interviewer RDD phone calls with SMS-to-web and some online sampling. |
| 97 | Leger | 1 | Purely non-probability opt-in online panel polling relying entirely on their proprietary LEO panel and demographic quota weighting. |
| 98 | M3 Strategies | 2 | Republican-aligned non-probability mixed methodology relying entirely on automated IVR phone calls and opt-in online web panels. |
| 99 | Elon U. | 4 | Academic probability polling utilizing dual-frame RDD live telephone interviews, increasingly adopting random SMS-to-web recruitment methods. |
| 100 | Gotham Polling & Analytics | 2 | Non-probability digital approach utilizing web intercepts, river sampling, and automated IVR for political modeling. |
| 101 | Yale Youth Poll | 1 | Pure non-probability approach relying strictly on opt-in online sampling and river recruitment targeting younger student demographics. |
| 102 | Remington | 2 | Heavily non-probability leaning methodology utilizing almost entirely automated telephone surveys (IVR) alongside some opt-in online panels. |
| 103 | Stetson University CPOR | 4 | Academic mixed mode using probability panel components plus phone/online; weighted with standard post-strat methods. |
| 104 | Tufts | 2 | Non-probability leaning academic mixed methodology (CIRCLE) heavily utilizing opt-in online panels and SMS-to-web for youth polling. |
| 105 | EPIC-MRA | 4 | Michigan-focused probability-leaning mixed methodology primarily utilizing traditional live interviewer calls alongside automated IVR from voter files. |
| 106 | St. Pete Polls | 2 | Pure non-probability methodology relying almost entirely on cheap automated telephone surveys (IVR) without live interviewers. |
| 107 | Rutgers-Eagleton | 5 | Gold-standard academic probability sampling utilizing traditional dual-frame RDD and voter-file based live interviews. |
| 108 | John Zogby Strategies | 1 | Pure non-probability methodology relying entirely on opt-in online panel web surveys and demographic quota weighting. |
| 109 | American Viewpoint | 2 | Republican-aligned mixed-mode combining traditional live telephone interviews from voter files with non-probability opt-in online panels. |
| 110 | Miami University (Ohio) | 2 | Non-probability leaning academic mixed-mode utilizing some live phone calls but relying heavily on opt-in online panel surveys. |
| 111 | PPIC | 4 | Probability-based academic survey methodology leveraging the high-quality ABS-recruited Ipsos KnowledgePanel alongside live telephone calls. |
| 112 | RABA Research | 2 | Boutique non-probability methodology relying strictly on a mix of automated IVR phone surveys and opt-in online web panels. |
| 113 | Montgomery Research | 4 | Probability-leaning methodology primarily utilizing high-quality live interviewer telephone polling sampled from official voter registration files. |
| 114 | UMass Amherst/YouGov | 1 | Academic non-probability collaboration relying entirely on YouGov’s massive opt-in online matched-panel methodology and MRP modeling. |
| 115 | Angus Reid | 1 | Prominent non-probability approach relying entirely on their proprietary opt-in online panel framework and quota weighting. |
| 116 | Paradigm | 2 | Non-probability leaning mixed methodology heavily utilizing automated IVR, SMS-to-web links, and opt-in online web panels for regional tracking. |
| 117 | Cherry Communications | 4 | High-volume probability methodology strictly utilizing live interviewer phone banking for Republican clients, drawn from official voter files. |
| 118 | Big Village | 1 | Pure non-probability methodology relying entirely on opt-in online panel sampling (formerly Engine Group) and web surveys. |
| 119 | Navigator | 1 | Progressive-leaning non-probability polling project relying entirely on opt-in online panel samples and SMS-to-web river surveys. |
| 120 | University of Texas at Tyler | 4 | Probability-leaning academic methodology utilizing dual-frame RDD live telephone interviews mixed with random SMS-to-web recruitment. |
| 121 | Survation | 1 | Purely non-probability opt-in online panel methodology utilizing advanced demographic and geographic MRP-style quota weighting. |
| 122 | Fairleigh Dickinson | 5 | High-quality academic probability polling relying exclusively on dual-frame RDD live interviewer telephone sampling. |
| 123 | HighGround | 4 | Arizona-centric live phone with online panel supplements; regional targeting and traditional weighting. |
| 124 | Hunt Research | 2 | Boutique non-probability leaning mixed methodology utilizing some live phone interviews alongside heavy opt-in online panel sampling. |
| 125 | Impact Research | 3 | Democratic-aligned probability methodology utilizing Registration-Based Sampling (RBS) via random Push-to-Web SMS and live telephone interviews. |
| 126 | Targoz Market Research | 1 | Pure non-probability approach relying entirely on digital data collection via opt-in online web panels and river sampling. |
| 127 | GQR | 4 | Democratic-aligned mixed-mode leaning probability; while utilizing some panels, core electoral work is anchored in random voter-file sampling. |
| 128 | U. Arizona/TrueDot | 2 | Non-probability leaning mixed methodology combining automated SMS-to-web river sampling with opt-in online web panels. |
| 129 | NMB Research | 4 | Republican-aligned probability methodology anchored in random voter-file sampling utilizing live telephone interviews and Push-to-Web SMS. |
| 130 | Deltapoll | 1 | Rapid-response non-probability approach relying strictly on opt-in online panel sampling and digital web intercepts. |
| 131 | GBAO | 3 | Democratic-aligned probability methodology utilizing Registration-Based Sampling (RBS) via Push-to-Web SMS and live caller telephone interviews. |
| 132 | McLaughlin | 2 | Republican-aligned non-probability methodology heavily utilizing automated IVR phone calls and opt-in online panels for campaign clients. |
| 133 | University of Wyoming | 5 | Non-partisan academic probability polling relying exclusively on traditional dual-frame RDD for landline and cell phone live calling. |
| 134 | Clarity | 2 | Democratic data firm utilizing non-probability mixed-mode approaches heavily relying on digital river SMS-to-web and opt-in online surveys. |
| 135 | Claflin University | 1 | Pure non-probability methodology utilizing digital river sampling and mobile web intercepts via the Pollfish network, corrected with demographic weighting. |
| 136 | Selzer | 5 | The traditional “Gold Standard” of pure probability polling, relying exclusively on true RDD live telephone interviews with minimal weighting. |