
Who's to blame for the 2025 shutdown?
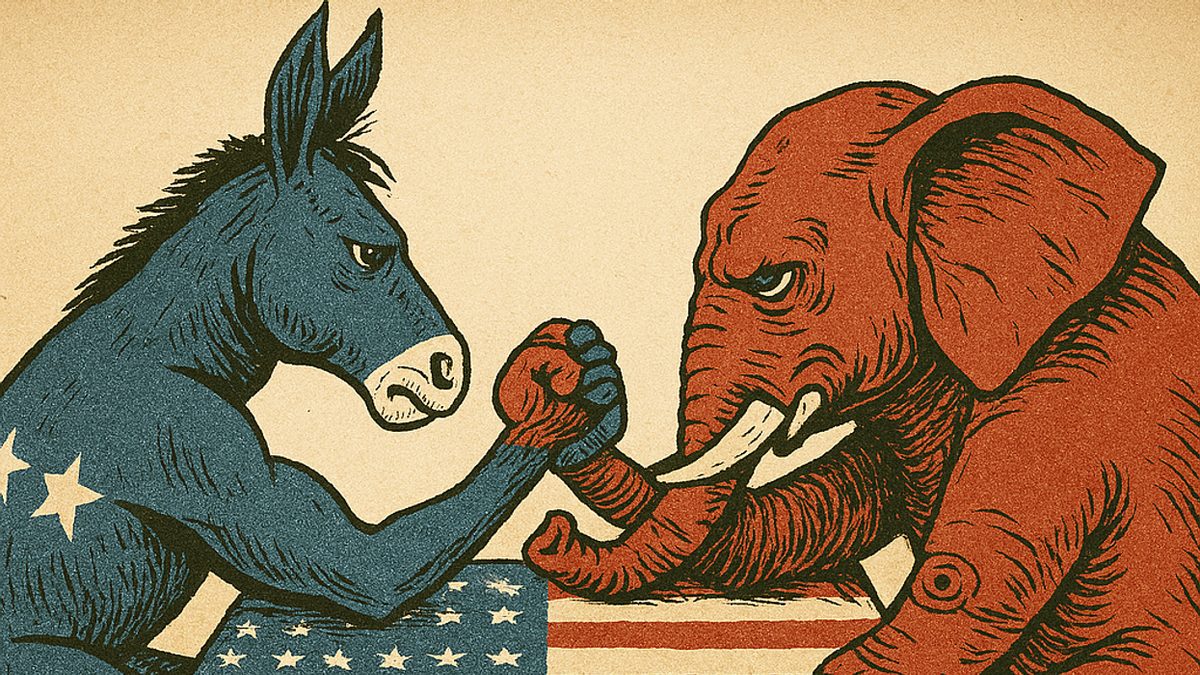
On October 1st, 2025, the Federal Government shut down. Democrats blamed Republicans for not negotiating on their demand to extend the enhanced Obamacare subsidies. They also claimed that with the Republican trifecta (President, control of the Senate and control of the House) it was up to the Republicans to find a solution.
Republicans blamed Democrats for not supporting the so-called “clean continuing resolution” which was passed in the House of Representatives on September 19th by the Republicans. They also pointed out that they only have 53 seats in the Senate and that 60 votes are needed to pass legislation in the Senate and therefore it is up to the Democrats to come to the table.
We wondered what the American people were thinking about who was to blame for the shutdown. So, we asked 556 registered voters (MoE of 4.2%) between November 8-10, 2025 about blame for the 2025 Government Shutdown:
Which of the following statements best reflects your opinion on who is to blame for this shutdown?
- The blame lies entirely with Democrats.
- The blame lies mostly with Democrats.
- Both parties are equally responsible.
- The blame lies mostly with Republicans.
- The blame lies entirely with Republicans.
The national electorate is divided on who is to blame, with a slightly larger percentage laying the blame with the Republicans (44%) than the Democrats (40%). The remaining 16% believe that both parties equally share in the blame.
If we partition the electorate in 5 equal groups of 20% each ranging from left to right, we can clearly see that each side of the spectrum mostly blames the other side:
On the left, 93% believe the Republicans are to blame and the remaining 7% believe both parties are equally responsible. On the moderate left 80% blame the Republicans with 17% blaming both parties, and only 3% believe it is the Democrats. On the other side of the Spectrum we see a similar pattern: 89% of the right blames the Democrats, with 8% blaming both parties. Only 3% blame the Republicans. On the moderate right 75% blame the Democrats with 22% holding both parties responsible, with again only 3% who look at the Republicans.
Those in the centre reflect the opinion of the country: slightly more (40%) believe the Republicans are to blame than the 35% who believe we should blame the Democrats, with one quarter (25%) holding both parties equally responsible.
In summary, this issue illustrates the current partisan divide, which may explain why the 2025 government shutdown will go into the history books as the longest government shutdown in history.
See here for more details on ActiVote’s polls.