
Voters Lean Negative on the U.S.-Iran Interim Agreement
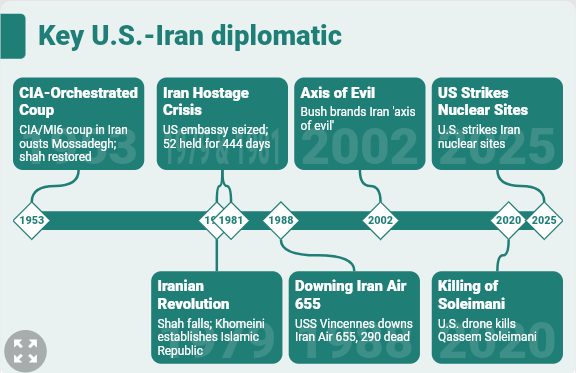
The United States and Iran have had decades of strained relations centered on sanctions, regional conflicts, and Iran’s nuclear program. Tensions have periodically affected shipping in the Strait of Hormuz, a critical route for global oil exports.
In June 2026, the two countries signed a 60-day interim agreement in Geneva to end hostilities, reopen the Strait of Hormuz, and begin negotiations on longer-term issues. Under the agreement, Iran is to allow commercial vessels to pass through the Strait without charge for 60 days, while the United States is to end its naval blockade of Iranian ports within 30 days. The deal also outlines a commitment to ensure Iran receives at least $300 billion for postwar recovery, though funding details are not specified.
We wondered what Americans think about the June 2026 U.S.-Iran interim agreement. So we asked 476 registered voters (MoE of 4.5%) from June 21 to June 28, 2026 about it.
What voters said
Disapproval outweighs approval. About 30% of respondents strongly disapprove of the agreement and another 13% disapprove, for a combined 43% on the negative side. On the positive side, 14% strongly approve and 16% approve, a combined 30%. A sizable 22% remain neutral, and 4% selected none of the above.
The intensity sits mostly on the negative end: strong disapproval (30%) is more than twice as common as strong approval (14%), while the neutral share is among the largest we see on current-affairs questions — a sign that many voters are still weighing a deal whose enforcement and funding details remain open.
Across the political spectrum
The ideological pattern is the reverse of what many might expect for a de-escalation agreement. Opposition is strongest on the Left, where 43% strongly disapprove and 9% disapprove, and on the Moderate Left, where fully 49% strongly disapprove and 17% disapprove — two-thirds negative. Approval in these groups is scarce, at roughly 21% and 9% respectively.
On the Right, the balance flips to net approval: 26% strongly approve and 29% approve, against 27% combined disapproval. The Moderate Right is more tempered, with 32% approving, 33% disapproving, and the largest neutral share of any group at 32%. The Center splits 31% approve to 41% disapprove, with 24% neutral.
Zooming out
The agreement earns more critics than supporters overall, but the divide is less about hawks versus doves than about who negotiated it: the Right leans supportive while the Left is strongly opposed. With a 60-day clock running and key enforcement and funding questions unresolved, opinion may still move as the deal’s follow-through becomes clearer.