
ActiVote
← All analysis
April 3, 2024

The NATO Military Alliance
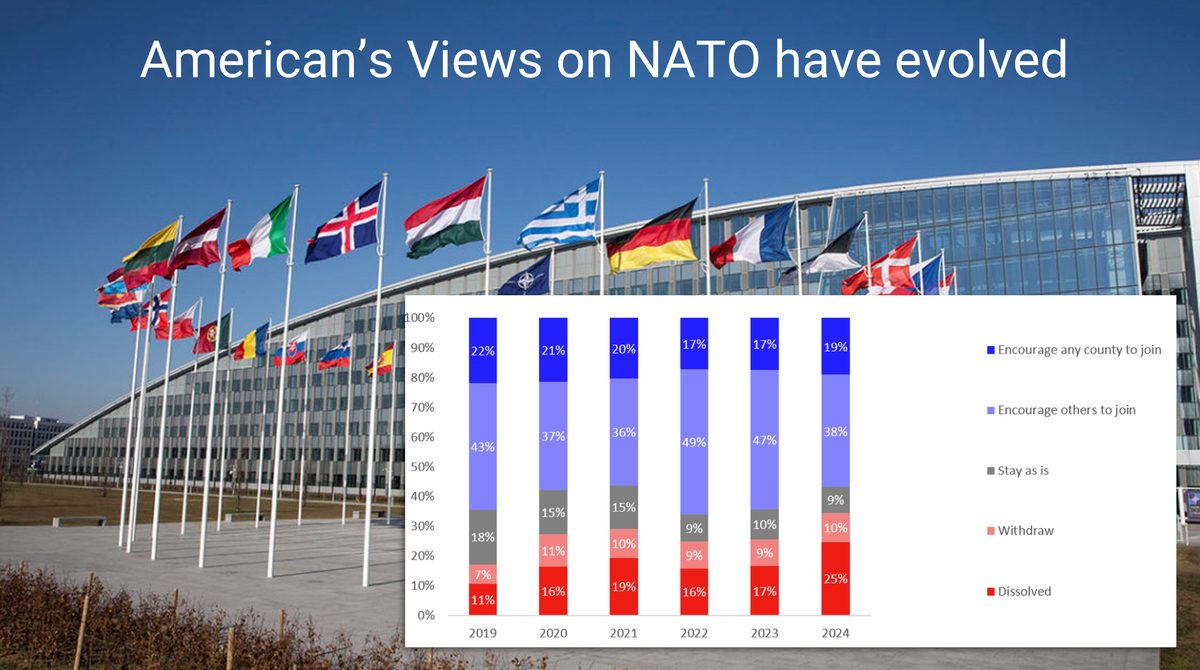
The North Atlantic Treaty Organization was founded in the wake of World War II and the start of the Cold War, on April 4th, 1949, exactly 75 years ago. NATO started with 12 founding members and has since grown to 32 members, with Finland and Sweden as the most recent additions, triggered by the Russian invasion of Ukraine.

Since 2019, ActiVote has asked voters their opinion about NATO Membership, as well as about the NATO Budget. The full text of these two questions is listed below:

NATO MEMBERSHIP (answered by 15,488 people)

Which of these statements best reflects your opinion on NATO membership?

  • The mission of NATO is no longer relevant and should be dissolved.
  • The US should withdraw from NATO, it should be a European organization.
  • NATO should remain in its current state.
  • All European countries currently eligible should be encouraged to join, and NATO should help other countries aspiring for membership to meet the political and economic criteria necessary.
  • NATO is paramount to security and peace, and membership should be extended to countries around the world.

NATO BUDGET (answered by 4,586 people).

Which of the following statements best reflects your opinion about budget for NATO?

  • NATO membership should not be questioned.
  • NATO membership should not be questioned but we should lobby for increased contributions by the other countries.
  • NATO membership should be questioned if countries do not meet their obligations by 2025.
  • NATO membership should be questioned in general.
  • We should leave NATO on short notice.

OVERALL FINDINGS

NATO Membership — the crosstabs
2019
11%
18%
43%
22%
2020
16%
11%
15%
37%
21%
2021
19%
10%
15%
36%
20%
2022
16%
9%
9%
49%
17%
2023
17%
9%
10%
47%
17%
2024
25%
10%
38%
19%
DissolvedWithdrawStay as isEncourage others to joinEncourage any county to join
See the details below →

In 2019, 82% of participants felt that NATO should stay the same or even expand, with only 18% wishing to leave NATO or have it dissolved. Support dropped in 2020 and 2021 to 73% and 71% respectively. In 2022 and 2023 support increased again to 75% and 74%, possibly in the wake of the Russian invasion and the collaboration between several NATO allies in supporting Ukraine. In 2024 support for NATO has dropped to the lowest recorded level in our poll of just 65%, perhaps due to “Ukraine fatigue” and increased calls to be less involved in foreign conflicts.

NATO Budget — the crosstabs
2019
9%
48%
27%
2020
10%
16%
9%
46%
19%
2021
17%
15%
24%
38%
2022
16%
12%
24%
39%
2023
16%
12%
23%
39%
10%
2024
16%
9%
24%
41%
10%
Leave NATO on short noticeQuestion NATO membership in generalOnly stay if others meet obligationsLobby for increased contributions by othersShould not question NATO membership
See the details below →

In 2019, there was significant support for NATO no matter what (27%), but a plurality believed that we should lobby for increased contributions from others. Over time, the overall level of support for NATO has decreased as well as the distribution between threatening to leave (increased) and lobbying or unqualified support (decreased) has changed. Thus, people still in majority believe that NATO should be supported, but only if the other members pull their weight.

POLITICAL SPECTRUM

If we look at opinions from left to right on the political spectrum, a very clear picture appears:

NATO Membership — the crosstabs
Left
48%
39%
Moderate Left
64%
23%
Center
13%
14%
50%
14%
Moderate Right
23%
15%
15%
38%
9%
Right
41%
22%
13%
18%
DissolvedWithdrawStay as isEncourage others to joinEncourage any county to join
See the details below →
NATO Budget — the crosstabs
Left
40%
43%
Moderate Left
13%
63%
20%
Center
13%
22%
49%
Moderate Right
18%
19%
26%
33%
Right
38%
24%
20%
17%
Leave NATO on short noticeQuestion NATO membership in generalOnly stay if others meet obligationsLobby for increased contributions by othersShould not question NATO membership
See the details below →

In both cases, the moderate left is most supportive of NATO, while the conservatives (right) are most skeptical, with close to ⅔ wishing to withdraw from NATO. The progressives (left) are less supportive overall, meaning that about 10% wish to leave NATO, but there are also far more progressives than moderates who unconditionally support NATO.

In summary, overall NATO still has the support of Americans in general, but the level of support has been dropping slowly but surely especially on the right end of the political spectrum. This is not unexpected given that these opinions align with those of the presumptive presidential candidates for the major parties. Biden, moderate left, is strongly supportive of NATO, while Trump, right, has questioned whether the U.S. should stay in NATO.

All in all, NATO’s 75th anniversary shows it has made it to a respectable age, but there is no guarantee it will live forever.

You can explore more details about ActiVote’s polling methodology and our latest polls.

The Details

Every question in this piece, with its answers as asked, its breakdowns by group and its methodology.

NATO Membership

Which of these statements best reflects your opinion on NATO membership?

We also asked this question once before:

What voters said

Percentages over all 5 choices · 15488 registered voters · MoE ±0.8%

Dissolved
17%
Withdraw
9%
Stay as is
11%
Encourage others to join
45%
Encourage any county to join
18%

The full crosstab table

ActiVote · NATO Membership · April 3, 2024
ActiVote 15488 RV Weighted Dissolved Withdraw Stay as is Encourage others to join Encourage any county to join
National ±0.8% MoE 100% 17% 9% 11% 45% 18%
Region rural 33% 20% 11% 11% 43% 15%
suburban 32% 16% 10% 11% 46% 18%
urban 35% 14% 7% 11% 46% 23%
Age 18-29 16% 14% 8% 12% 43% 22%
30-49 32% 20% 9% 9% 42% 20%
50-64 24% 17% 10% 12% 44% 17%
65+ 28% 14% 10% 11% 50% 15%
Gender F 53% 14% 8% 9% 48% 20%
M 47% 19% 11% 13% 41% 16%
Affiliation D 40% 7% 3% 8% 56% 27%
R 30% 25% 17% 14% 36% 8%
I 28% 19% 10% 11% 41% 19%
Ethnicity White 69% 17% 11% 11% 44% 17%
Black 11% 10% 3% 13% 50% 23%
Latino 13% 17% 7% 10% 46% 21%
Income Low 22% 15% 11% 13% 44% 18%
Middle 42% 18% 10% 10% 43% 19%
High 36% 16% 8% 11% 47% 18%
Education Highschool 33% 17% 12% 11% 43% 17%
Some College 23% 19% 9% 10% 44% 18%
BSC+ 44% 15% 8% 11% 47% 20%
Year 2019 11% 7% 18% 43% 22%
2020 16% 11% 15% 37% 21%
2021 19% 10% 15% 36% 20%
2022 16% 9% 9% 49% 17%
2023 17% 9% 10% 47% 17%
2024 25% 10% 9% 38% 19%
Methodology. Fielded 2019 – April 2024 among 15488 registered voters nationwide. Responses weighted by Demographics and Spectrum. Average expected error ±0.8%. See Why trust our polls? for the methodology, disclosures and accuracy record.

NATO Budget

Which of the following statements best reflects your opinion about budget for NATO?

What voters said

Percentages over all 5 choices · 4586 registered voters · MoE ±1.4%

Leave NATO on short notice
14%
Question NATO membership in general
13%
Only stay if others meet obligations
17%
Lobby for increased contributions by others
41%
Should not question NATO membership
15%

The full crosstab table

ActiVote · NATO Budget · April 3, 2024
ActiVote 4586 RV Weighted Leave NATO on short notice Question NATO membership in general Only stay if others meet obligations Lobby for increased contributions by others Should not question NATO membership
National ±1.4% MoE 100% 14% 13% 17% 41% 15%
Region rural 33% 17% 12% 25% 39% 8%
suburban 32% 14% 16% 16% 41% 13%
urban 35% 11% 10% 12% 42% 24%
Age 18-29 16% 10% 10% 17% 43% 20%
30-49 32% 18% 12% 15% 39% 16%
50-64 24% 13% 15% 17% 40% 15%
65+ 28% 12% 13% 20% 43% 12%
Gender F 53% 10% 11% 18% 43% 18%
M 47% 18% 15% 17% 38% 12%
Affiliation D 40% 5% 6% 11% 49% 29%
R 30% 22% 19% 24% 33% 2%
I 28% 14% 15% 18% 39% 13%
Ethnicity White 69% 14% 14% 19% 39% 14%
Black 11% 9% 7% 17% 51% 17%
Latino 13% 19% 13% 12% 38% 17%
Income Low 22% 18% 11% 18% 42% 12%
Middle 42% 13% 14% 19% 38% 16%
High 36% 13% 13% 16% 42% 16%
Education Highschool 33% 14% 17% 16% 40% 14%
Some College 23% 21% 10% 16% 38% 15%
BSC+ 44% 10% 11% 19% 43% 16%
Year 2019 8% 9% 8% 48% 27%
2020 10% 16% 9% 46% 19%
2021 17% 15% 24% 38% 6%
2022 16% 12% 24% 39% 8%
2023 16% 12% 23% 39% 10%
2024 16% 9% 24% 41% 10%
Methodology. Fielded 2019 – April 2024 among 4586 registered voters nationwide. Responses weighted by Demographics and Spectrum. Average expected error ±1.4%. See Why trust our polls? for the methodology, disclosures and accuracy record.