
ActiVote
← All analysis
September 20, 2020

Supreme Court Term Limits
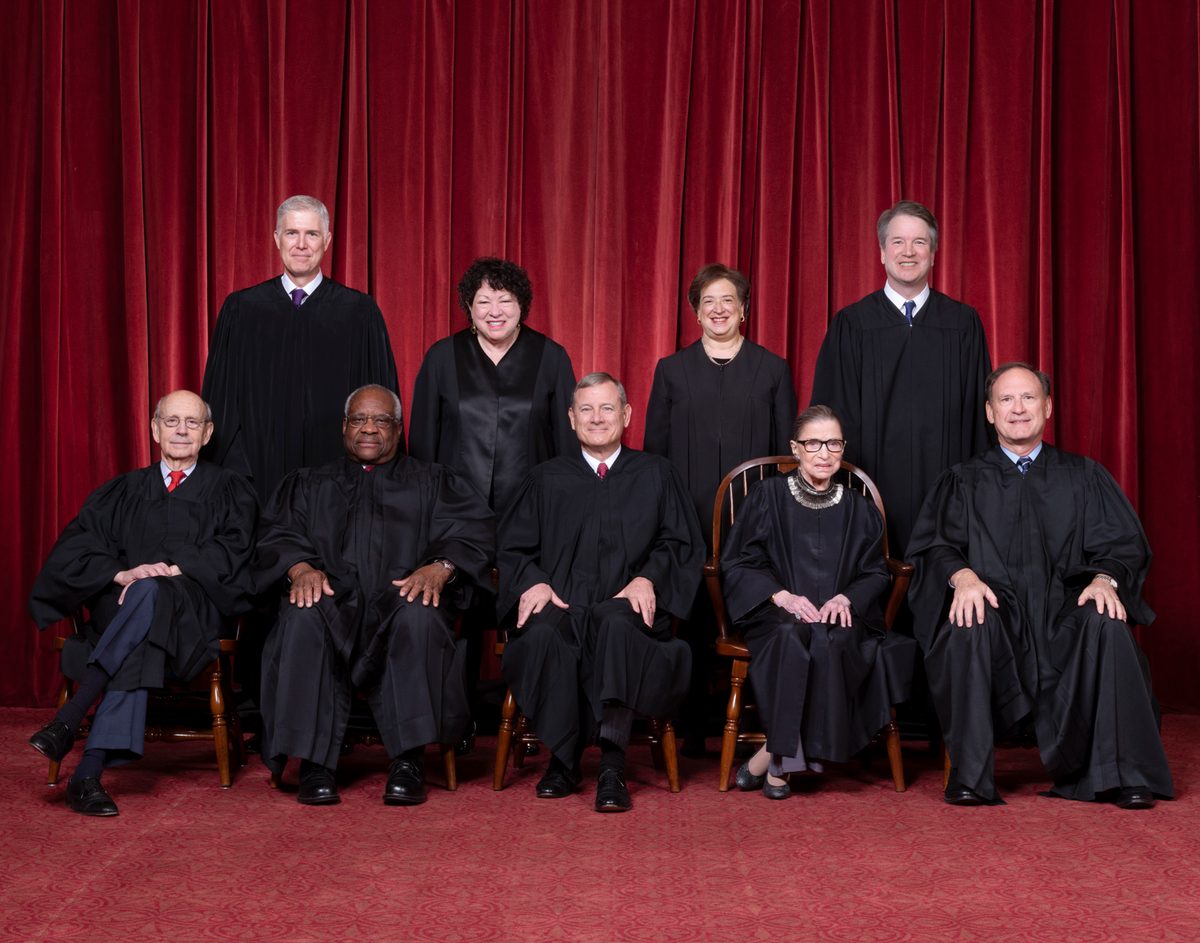
On Friday September 19th, Justice Ruth Bader Ginsberg passed away, bringing partisan politics surrounding Supreme Court nominations and confirmations back in the spotlight. It will likely also spur discussions about Supreme Court reforms, possibly including the question about term limits for the Supreme Court. Justice Ginsberg served 27 years on the Court, having been appointed by President Clinton in 1993.

ActiVote conducted a survey in the ActiVote app regarding term limits for the Supreme Court providing five options to choose from, which can be summarized as follows:

  • Term limits of 10 years.
  • Term limits of 18 years.
  • Term limits, but duration to be discussed.
  • Depoliticize, but not through term limits.
  • Keep the Supreme Court as is.

This results of this survey are exceptional in the combination of a great diversity of opinion while limited partisanship in that opinion.

The headline result
10 years
22%
18 years
7%
limits to be discussed
33%
depoliticized, but not this way
24%
left as is
15%
See the details below →

We found that a large majority of 85% wants some form of change, and about 60% sees term limits as an option to do so. That 60%, however, seems divided about how long those term limits should be.

The crosstabs
Men
19%
29%
27%
19%
Women
26%
37%
19%
10%
10 years18 yearslimits to be discusseddepoliticized, but not this wayleft as is
See the details below →

About 70% of women see term limits as a good solution, while only just over 50% of men agree with that.

The crosstabs
18-29
27%
18%
31%
17%
30-49
20%
40%
21%
12%
50-64
20%
29%
31%
18%
65+
19%
11%
46%
10%
13%
10 years18 yearslimits to be discusseddepoliticized, but not this wayleft as is
See the details below →

While older voters seem slighter more open to term limits as (part of) a solution, younger voters are more strongly favoring shorter term limits.

The crosstabs
Dem
20%
49%
21%
Rep
24%
13%
10%
29%
24%
Ind
29%
31%
24%
11%
10 years18 yearslimits to be discusseddepoliticized, but not this wayleft as is
See the details below →

There is a small split among party lines on this topic with a slight majority (53%) of Republicans opposing term limits, while only 27% of Democrats oppose them. At the same time, 37% of Republicans are happy with a specific solution of either 10 or 18 year term limits, while Democrats are more hesitant in picking a particular duration and only 25% support these specific durations.

Overall, term limits may play some role in the discussion on depoliticizing the Supreme Court, and while it is encouraging that there is no strong partisan divide in the opinions around term limits, it seems there is insufficient clear support for a particular term limit solution to expect that these will be enacted any time soon.

The Details

The answers as asked

Charts and tables use the short label at the start of each line.

  1. 10 years: Supreme Court justices should have a term limit of 10 years.
  2. 18 years: Supreme Court justices should have a term limit of 18 years.
  3. limits to be discussed: There should be term limits on Supreme Court justices, but the specific number should be discussed more.
  4. depoliticized, but not this way: The Supreme Court should be depoliticized, but term limits is not the way to do it.
  5. left as is: The Supreme Court should be left as is.

The full crosstab table

ActiVote · Supreme Court Term Limits · September 20, 2020
ActiVote 984 RV 10 years 18 years limits to be discussed depoliticized, but not this way left as is
National ±3.1% MoE 22% 7% 33% 24% 15%
Gender Men 19% 6% 29% 27% 19%
Women 26% 8% 37% 19% 10%
Age 18-29 27% 7% 18% 31% 17%
30-49 20% 7% 40% 21% 12%
50-64 20% 3% 29% 31% 18%
65+ 19% 11% 46% 10% 13%
Ethnicity White 24% 11% 30% 16% 19%
Black 19% 5% 48% 25% 4%
Latino 16% 5% 38% 23% 18%
Education High school 22% 5% 41% 16% 15%
Some college 20% 8% 30% 30% 13%
Bachelor's 24% 9% 27% 24% 16%
Income <50k 24% 6% 36% 11% 23%
50k-100k 25% 6% 34% 23% 12%
>100k 17% 10% 27% 36% 10%
Affiliation Dem 20% 5% 49% 21% 6%
Rep 24% 13% 10% 29% 24%
Ind 29% 5% 31% 24% 11%
Region Dark Red 29% 10% 23% 19% 18%
Light Red 19% 7% 41% 24% 9%
Swing 16% 2% 35% 30% 17%
Light Blue 35% 8% 10% 29% 18%
Dark Blue 12% 8% 51% 17% 11%
Methodology. Fielded September 2020 among 984 registered voters nationwide. Responses weighted by Demographics and Spectrum. Average expected error ±3.1%. See Why trust our polls? for the methodology, disclosures and accuracy record.