
Stop Changing The Clocks!
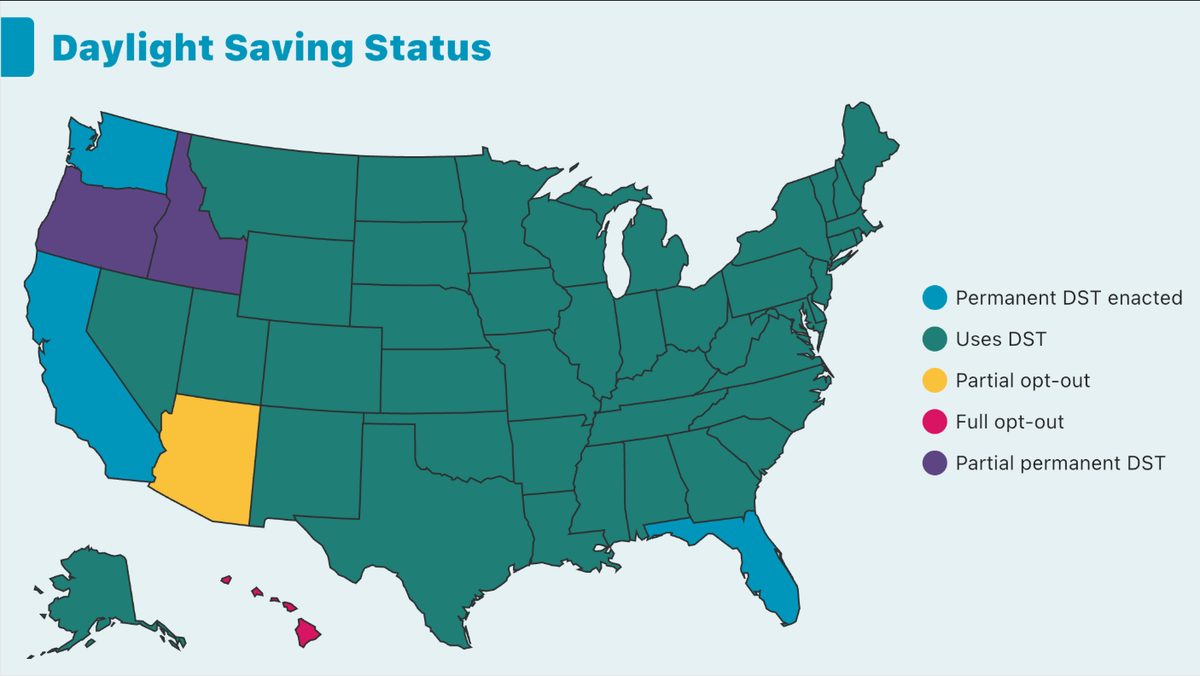
The long-running debate over Daylight Saving Time has gained new momentum as Congress considers changing how the U.S. keeps time. In July 2026, the House passed the Sunshine Protection Act, which would make Daylight Saving Time permanent if the Senate also approves it.
Time policy affects daily routines across the country, from school start times to business hours and transportation schedules. While the current system requires clock changes twice a year, past efforts to adopt a single year-round system — especially permanent Daylight Saving Time — have drawn mixed reactions, particularly during winter months with later sunrises.
We wondered what Americans think about making Daylight Saving Time permanent in the United States. So we asked 559 registered voters (MoE of 4.1%) from July 27 to August 2, 2026 about it:
Which of the following statements best reflects your opinion on making Daylight Saving Time permanent in the United States?
- Daylight Saving Time should be permanent nationwide
- States should be allowed to adopt permanent Daylight Saving Time
- The current system of changing clocks should remain
- The U.S. should switch to permanent standard time
- Each state should set its own time system
What voters said
The largest share of respondents, 49%, say “The U.S. should switch to permanent standard time,” making it the clear leading preference. About 26% say “Daylight Saving Time should be permanent nationwide,” while 13% prefer “The current system of changing clocks should remain.” Smaller shares chose “States should be allowed to adopt permanent Daylight Saving Time” (5%) or “Each state should set its own time system” (4%), and 3% selected none of the above.
Taken together, the results show that many respondents favor ending the twice-yearly clock changes, but there is a clear preference for permanent standard time over permanent Daylight Saving Time. Other alternatives, including state-level flexibility, draw comparatively limited support.
Across the political spectrum
“The U.S. should switch to permanent standard time” leads across every part of the political spectrum, with 59% on the Left, 54% among Moderate Left, 46% in the Center, 44% among Moderate Right, and 42% on the Right. In contrast, support for “Daylight Saving Time should be permanent nationwide” increases moving rightward, from 22% on the Left to 35% on the Right.
Support for “The current system of changing clocks should remain” is more concentrated in the middle, reaching 23% among Center respondents and 19% among Moderate Left, compared with 9% on the Left and 5% on the Right. The idea that “Each state should set its own time system” is most common on the Right at 10%, while remaining lower in other groups.
Zooming out
Over the past five years ActiVote has kept track of public sentiment on Daylight Saving Time through the following question:
Which of these statements best reflects your opinion about Daylight Saving Time?
- DST should be made permanent throughout the full year.
- DST should remain as it is today.
- DST should be left to the States.
- DST should be discontinued at some point.
- DST should be immediately discontinued.
Between 2022 and 2026 the following number of people weighed in: 1125, 454, 977, 346 and 358, for an average of 652 per year.
Responses weighted by Demographics and Spectrum. Responses per year — 2022: 1,125, 2023: 454, 2024: 977, 2025: 346, 2026: 358.
The results are very much in line with this week’s poll: in every one of those years a clear majority (54%-68%) wanted Daylight Saving Time to end while a much smaller group (14%-24%) wanted it made permanent. The total group of people preferring one of these two options ranges from 76% to 81% over the years.
However the question is framed, and independent of whether we look at the last five years, or just last week, the conclusion is the same: Americans want to stop changing their clocks twice a year. When they are asked what should replace the current system, permanent standard time is far preferred over permanent Daylight Saving Time.
It seems that lawmakers are listening to the country by moving away from changing clocks twice a year and are not listening to the country by ignoring permanent standard time as the preferred solution.
See more of what America thinks in our ongoing polls.