
Statehood for DC?
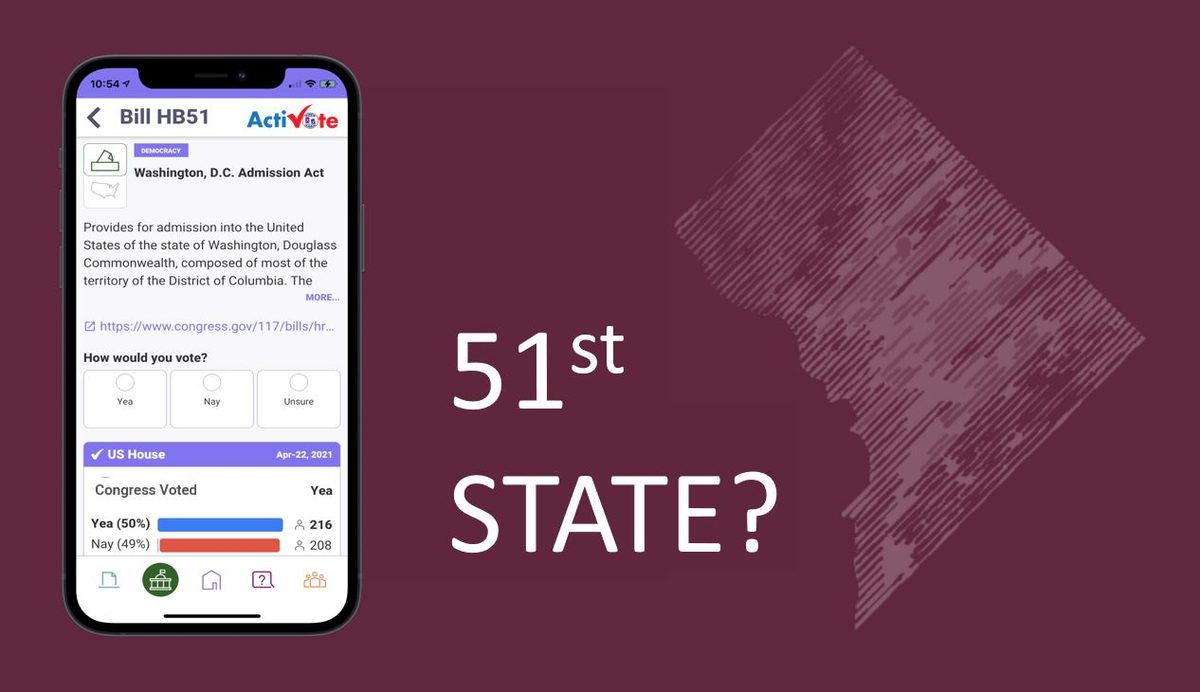
Last week, the House of Representatives, on a purely partisan basis, passed H.R. 51, “An act to provide for the admission of the State of Washington, Douglass Commonwealth into the Union”.
Some of the arguments for statehood are about the merits of the case:
- taxation without representation with DC residents paying more taxes than residents of 22 other states,
- DC would not be the least populous state, but instead be the 3rd after Wyoming and Vermont,
- the desire of DC residents to become a state (~85% is in favor)
- the argument that it is racist to deny voter rights to the one area that happens to have the largest Black constituency in the nation with almost 47%.
Some of the arguments against statehood are also about the merits:
- DC would be more than 17 times smaller than the next smallest state (Rhode Island),
- DC is specifically mentioned in the constitution and therefore DC statehood cannot be done legislatively (by Congress) but must be done through a constitutional amendment.
- DC would be different from every other state as it would not have any rural areas, would not be self-sufficient but depending on surrounding states.
However, most of the discussions are about the political implications and motivations: the 2 reliably Democratic senators that would come from the new state, tipping the balance of power in the senate from a precarious 50/50 split today to a 52-50 advantage for the Democrats. Which explains the passage of H.R. 51 entirely along party lines.
We asked our users to weigh in and gave them five answers to pick from:
- DC should become a state with full benefits, including 2 senators and a representative in the House.
- DC should get voting rights, as if it were a state, as stated in the non-ratified 1978 amendment.
- Most of DC (except the small portion that contains the White House, Capital Hill, the Supreme Court etc.) should become part of Maryland (as it was before 1790), which will add no senators, but increases the number of representatives for Maryland by 1.
- The current situation should be maintained.
- DC should not be granted statehood and the 23rd Amendment should be repealed and their electoral votes removed.
It turns out that 60% of the nation is in favor of giving the population of DC full representation in Congress, including their 2 senators. Of those 60%, ¾ chooses full statehood, while the other ¼ favors just the voting rights. The Maryland option is supported by about 1 in 6 voters.
It is not lost on the voters that DC would be the first state with a larger Black than White population and this could possibly explain the significant support (5 out of every 6) among Black voters for full statehood, and 9 out of 10 for full representation in Congress.
The partisan divide is significant, but not as polarized as in Congress: 75% of Democrats support DC full representation (either through statehood or the 1978 amendment), while 38% of Republicans support at least the Voting Rights, although only a small group of those support full statehood.
All in all, DC Statehood remains a complicated issue which, if passed in the 50/50 divided Senate and signed into law by President Biden, will likely end up at the Supreme Court. With that, there seems no need to pre-order your 51-star version of Old Glory just yet.