
ActiVote
← All analysis
December 13, 2021

Reconciliation Review
Introduction

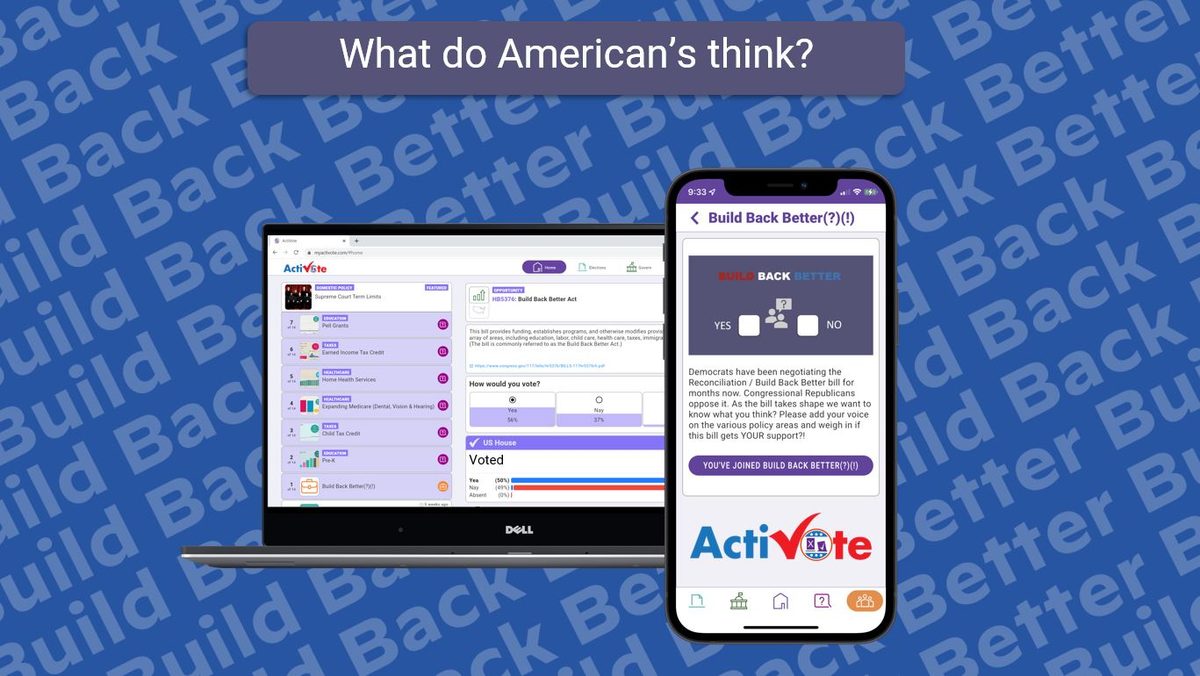
As part of the Build Back Better event, run in the ActiVote app from November 3rd -November 17th, 2021, a poll on 11 topics and 2 bills was executed.
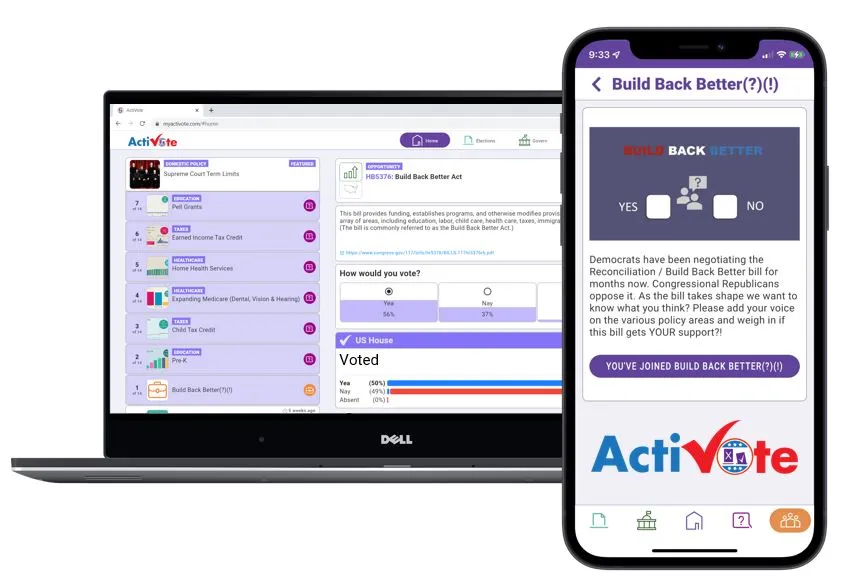
The two bills were H.R. 5376 “Build Back Better Act” and SCR 14, the “Reconciliation Bill”. Each bill consisted of title, summary description, link to the full bill text, and the votes cast by a participant’s representatives as well as the overall votes cast in Congress. The three choices available to users were “Yea”, “Nay” and “Unsure”.

Polling Results Per Topic

In this chapter we are presenting the polling results per topic.

Pre-K

There is majority support (58%) for extending Kindergarten to include children of age 4. A large minority of 44% wants to include also children who are 3 years old.

Pre-K — the headline result
remove Kindergarten
10%
don't extend at this time
20%
study the issue
11%
include age 4
14%
include age 3 and up
44%
See the details below →

Pre-K is a somewhat partisan issue with 75% of Democrats favoring extending it including 64% who want to include the 3-year-olds. There are more Republicans (49%) who favor not extending Kindergarten than those who do (38%).

Pre-K — the crosstabs
Dem
11%
11%
64%
Rep
14%
35%
14%
14%
24%
Ind
12%
19%
10%
17%
40%
remove Kindergartendon't extend at this timestudy the issueinclude age 4include age 3 and up
See the details below →

Child Tax Credit

A small majority of 56% of voters believes that the current child tax credit value (or more) is the right solution. Only 10% believe there should be no Child Tax Credit at all.

Child Tax Credit — the headline result
Repeal the CTC
10%
$1000/child per year
15%
$2000/child per year
18%
$3000-$3600/child per year
43%
More than $3600/child per year
13%
See the details below →

Interestingly, the child tax credit is a very bipartisan issue, with 44% of Democrats and 38% of Republicans supporting the current levels or more, although there are more Republicans who wish to abolish it or go back to pre-Trump era levels (40%) than Democrats (29%). Independents are the strongest supports with a clear majority of 68% supporting current or higher levels.

Child Tax Credit — the crosstabs
Dem
28%
27%
35%
9%
Rep
24%
16%
22%
30%
Ind
25%
54%
14%
Repeal the CTC$1000/child per year$2000/child per year$3000-$3600/child per yearMore than $3600/child per year
See the details below →

Expanding Medicare (Dental, Vision & Hearing)

A significant majority of 70% believe that Medicare should be expanded with at least dental, vision and hearing.

Expanding Medicare — the headline result
fully expand with these and more
56%
fully cover dental, vision and hearing
14%
partially cover dental, vision and hearing
9%
stay as is
8%
reduced instead of expanded
14%
See the details below →

There are some clear partisan differences on this topic: Democrats (73%) and Independents (80%) favor expanding Medicare fully with dental, vision and hearing. Republicans are split on the issue with 39% for doing nothing (or even reducing benefits) and another 39% believes in fully expanding Medicare.

Expanding Medicare — the crosstabs
Dem
59%
14%
9%
10%
Rep
30%
9%
22%
19%
20%
Ind
63%
17%
19%
fully expand with these and morefully cover dental, vision and hearingpartially cover dental, vision and hearingstay as isreduced instead of expanded
See the details below →

Home Health Services

A majority of 71% believes that we should increase funding for Home Health Services, either on a means-tested basis or for everyone over 65. Only 13% wish to decrease funding.

Home Health Services — the headline result
discontinue federal funding
10%
decrease federal funding
3%
keep at current levels
14%
increase for those who cannot afford it
32%
increase for everyone over 65
39%
See the details below →

Almost all Democrats (86%) support expanding Home Health Services funding, while significant majorities of Republicans (63%) and Independents (61%) agree with them.

Home Health Services — the crosstabs
Dem
9%
37%
49%
Rep
26%
27%
36%
Ind
28%
39%
22%
discontinue federal fundingdecrease federal fundingkeep at current levelsincrease for those who cannot afford itincrease for everyone over 65
See the details below →

Earned Income Tax Credit

A significant majority (75%) believes that the Earned Income Tax Credit should be increased, with only 16% believing it should be reduced or abolished.

Earned Income Tax Credit — the headline result
Increased to lift everyone out of poverty
40%
Increasing as part of overall strategy
35%
Should stay as is
9%
Reduce EITC
6%
Abolish EITC
10%
See the details below →

Nearly all Democrats (93%) wish to increase the EITC, 77% of Independents feel the same. There is also a slim majority among Republicans of 53%.

Earned Income Tax Credit — the crosstabs
Dem
43%
50%
Rep
14%
39%
13%
14%
21%
Ind
51%
26%
12%
Increased to lift everyone out of povertyIncreasing as part of overall strategyShould stay as isReduce EITCAbolish EITC
See the details below →

Pell Grants

A majority of 63% believes that Pell Grants should be expanded to more people, while only 18% wish to reduce their availability, or abolish them completely.

Pell Grants — the headline result
should be abolished
12%
restricted to fewer people
6%
fine as is
18%
expanded to more people
30%
universally available
33%
See the details below →

Democrats (73%) and Independents (62%) in majority favor increasing Pell Grant availability. Republicans are less enthusiastic, with only 41% supporting extending them. However, Republicans still view Pell Grants favorably, with only 26% supporting reduction or abolishing them.

Pell Grants — the crosstabs
Dem
9%
10%
40%
33%
Rep
21%
33%
24%
17%
Ind
9%
23%
24%
38%
should be abolishedrestricted to fewer peoplefine as isexpanded to more peopleuniversally available
See the details below →

Section 8 Housing Vouchers

A small majority of 54% wishes to increase funding for this program, while 37% wish to reduce or cancel it.

Section 8 Housing Vouchers — the headline result
should be cancelled
10%
limited to disabled, elderly and veterans
27%
left as is
8%
increase funding
19%
fully funded to eliminate waiting lists
35%
See the details below →

Most Democrats (74%) would like to increase funding for Section 8 Housing Vouchers. Independents increase in majority (58%) as well. There is strong opposition from Republicans, where 68% wish to reduce funding for the program.

Section 8 Housing Vouchers — the crosstabs
Dem
15%
28%
46%
Rep
14%
54%
12%
13%
Ind
19%
15%
23%
35%
should be cancelledlimited to disabled, elderly and veteransleft as isincrease fundingfully funded to eliminate waiting lists
See the details below →

Solar Tax Credits

A large majority of 76% would like to extend solar tax credits for at least another 10 years.

Solar Tax Credits — the headline result
extend indefinitely
47%
extend for 10+ years
29%
taper off slowly after 2022
5%
end by 2022
9%
halted immediately
10%
See the details below →

There are majorities for the extension of Solar Tax Credits by at least 10 years among all parties: Democrats (89%), Independents (72%) and Republicans (60%).

Solar Tax Credits — the crosstabs
Dem
48%
41%
Rep
32%
28%
15%
17%
Ind
41%
31%
13%
extend indefinitelyextend for 10+ yearstaper off slowly after 2022end by 2022halted immediately
See the details below →

Rural Development

Only 49% of voters would like to heavily invest in rural development. The other half would like to either promote it, leave it to the market, or just does not believe that there is a problem to be solved.

Rural Development — the headline result
heavily invest for all rural communities
37%
heavily invest for least developed rural communities
12%
promote investment in least developed rural communities
30%
leave to the market
17%
shift from rural to urban is fine
3%
See the details below →

Democrats are most supportive of heavily investing in rural development (58%), followed by Republicans (46%). Only 35% of Independents support this. If we include those who believe in supporting investment, the support increases to resp. 92% (D), 69% (R) and 73% (I).

Rural Development — the crosstabs
Dem
41%
17%
34%
Rep
32%
14%
23%
29%
Ind
27%
39%
23%
heavily invest for all rural communitiesheavily invest for least developed rural communitiespromote investment in least developed rural communitiesleave to the marketshift from rural to urban is fine
See the details below →

Tax Gap

A large majority of 70% believes that we should work hard, either through legislation or more funding to the IRS to close the tax gap. Only 18% believes that we should either do nothing, or even less to close to tax gap.

Tax Gap — the headline result
legislate to aggressively close the tax gap
46%
more funding to IRS to close the tax gap
24%
focus on low-hanging fruit
13%
current situation is fine
7%
less focus on tax gap
11%
See the details below →

There is little partisan divide on this topic: 56% of Republicans, 60% of Independents and 73% of Democrats believe that we should do (much) more to close the tax gap.

Tax Gap — the crosstabs
Dem
39%
34%
10%
10%
Rep
38%
18%
13%
9%
22%
Ind
46%
14%
24%
11%
legislate to aggressively close the tax gapmore funding to IRS to close the tax gapfocus on low-hanging fruitcurrent situation is fineless focus on tax gap
See the details below →

Global Minimum Tax

A small majority of 57% thinks that there should be a Global Minimum Tax at least for all developed countries. A sizeable group of 38% thinks that the current situation with disparate tax rates is fine, or that further competition between countries should be allowed.

Global Minimum Tax — the headline result
binding global minimum tax for all countries
40%
global minimum tax for all developed countries
17%
global minimum tax for all multinationals
7%
current situation is fine
12%
countries should compete more on taxes
26%
See the details below →

There is a clear partisan divide with 64% of Republicans wanting to see the current or more competition on Tax Rates, while 70% of Democrats would like to see Global Minimum Tax enforced, at least for developed countries. Independents side with the Democrats on this topic.

Global Minimum Tax — the crosstabs
Dem
50%
20%
10%
13%
Rep
22%
19%
45%
Ind
56%
14%
16%
binding global minimum tax for all countriesglobal minimum tax for all developed countriesglobal minimum tax for all multinationalscurrent situation is finecountries should compete more on taxes
See the details below →

SCR 14: “The Build Back Better Act”.

Overall, the Democratic reconciliation bill is somewhat popular among the electorate with 52% for, and 38% voting against, with 1 in 10 people unsure about it.

SCR 14 (Reconciliation Bill) — the headline result
Yes
52%
Unsure
9%
No
38%
See the details below →

Democrats strongly support the bill, Republican strongly oppose it, and Independents are evenly split on it.

SCR 14 (Reconciliation Bill) — the crosstabs
Dem
76%
9%
15%
Rep
11%
11%
78%
Ind
46%
11%
43%
YesUnsureNo
See the details below →

H.R. 5376: “Build Back Better Act”

Slightly higher support for this version of the bill than the original bill going through the senate, with 58% for and 34% against.

H.R. 5376 (Build Back Better Act) — the headline result
Yes
58%
Unsure
8%
No
34%
See the details below →

The partisan divide on this bill is again very clear: 93% of Democrats are for and 72% of Republicans are against. Independents are supportive of the bill with 58% for and 32% against.

H.R. 5376 (Build Back Better Act) — the crosstabs
Dem
93%
Rep
19%
72%
Ind
58%
10%
32%
YesUnsureNo
See the details below →

Conclusion

Although there is always the possibility to misread the motivations of survey participants from the multiple-choice answers given by them, we do believe it is useful to seek the overarching narrative that can be read from a set of related survey questions. We try to formulate one possible narrative in this section.

There is overall majority support for all measures presented in this poll, each of which is a part of the Build Back Better Act, with as only exception “Rural Development”, where only 49% supports significant investments.

At the same time, only a few topics attract bipartisan support: Home Health Services, Earned Income Tax Credit, Solar Tax Credits and closing the Tax Gap.

In all cases, even if majorities of all major groups polled (Democrats, Republicans, and Independents) supported an investment, the support among Democrats was the strongest and support among Republicans the weakest.

Overall, with Democrats in majority supporting every measure in the bill and Republican majorities available for less than half of the measures, it is to be expected that there will be little to no support for these bills from Republicans in Congress. If we then add the politics of the situation, it is likely that not a single Republican in Congress will support these bills.

The Details

Every question in this piece, with its answers as asked, its breakdowns by group and its methodology.

Pre-K

Should our public education system be extended to include pre-K children of age 4, or age 3 and up?

The answers as asked

Charts and tables use the short label at the start of each line.

  1. remove Kindergarten: We should remove Kindergarten from the public school scope.
  2. don't extend at this time: We should not extend our public education system to pre-K at this time.
  3. study the issue: We should invest in further study of the issue.
  4. include age 4: We should extend our public education system to include age 4.
  5. include age 3 and up: We should extend our public education system to include age 3 and up.

The full crosstab table

ActiVote · Pre-K · December 13, 2021
ActiVote 4335 RV remove Kindergarten don't extend at this time study the issue include age 4 include age 3 and up
National ±1.5% MoE 10% 20% 11% 14% 44%
Gender Men 13% 24% 11% 13% 40%
Women 8% 16% 11% 16% 50%
Age 18-29 6% 20% 17% 13% 43%
30-49 10% 20% 12% 11% 46%
50-64 7% 19% 8% 21% 44%
65+ 21% 21% 3% 12% 42%
Ethnicity White 10% 24% 12% 13% 42%
Black 7% 10% 12% 16% 56%
Latino 18% 20% 11% 16% 34%
Education High school 9% 22% 8% 13% 47%
Some college 16% 16% 13% 12% 43%
Bachelor's 5% 23% 12% 17% 44%
Income <50k 5% 23% 13% 15% 44%
50k-100k 11% 19% 10% 17% 43%
>100k 15% 19% 10% 9% 46%
Affiliation Dem 5% 11% 8% 11% 64%
Rep 14% 35% 14% 14% 24%
Ind 12% 19% 10% 17% 40%
Region Dark Red 5% 26% 9% 21% 39%
Light Red 16% 22% 7% 12% 43%
Swing 11% 16% 15% 18% 39%
Light Blue 6% 20% 13% 10% 51%
Dark Blue 12% 17% 11% 10% 50%
Methodology. Fielded December 2021 among 4335 registered voters nationwide. Responses weighted by Demographics and Spectrum. Average expected error ±1.5%. See Why trust our polls? for the methodology, disclosures and accuracy record.

Child Tax Credit

What should the annual value of the Child Tax Credit be?

The answers as asked

Charts and tables use the short label at the start of each line.

  1. Repeal the CTC: We should repeal the CTC.
  2. $1000/child per year: The CTC should be approximately $1,000/child annually.
  3. $2000/child per year: The CTC should be approximately $2,000/child annually.
  4. $3000-$3600/child per year: The current CTC of between $3,000 and $3,600/child annually is about right.
  5. More than $3600/child per year: The CTC should be increased further.

The full crosstab table

ActiVote · Child Tax Credit · December 13, 2021
ActiVote 249 RV Repeal the CTC $1000/child per year $2000/child per year $3000-$3600/child per year More than $3600/child per year
National ±6.2% MoE 10% 15% 18% 43% 13%
Gender Men 11% 15% 19% 43% 12%
Women 8% 15% 17% 44% 16%
Age 18-29 16% 5% 22% 37% 19%
30-49 6% 21% 16% 44% 13%
50-64 13% 8% 14% 52% 12%
65+ 18% 15% 30% 36% 2%
Ethnicity White 13% 12% 19% 43% 14%
Black 1% 25% 16% 48% 10%
Latino 31% 17% 0% 31% 21%
Education High school 7% 7% 13% 55% 18%
Some college 7% 22% 19% 39% 13%
Bachelor's 20% 13% 23% 35% 9%
Income <50k 5% 26% 23% 39% 8%
50k-100k 12% 8% 12% 53% 15%
>100k 16% 8% 18% 38% 20%
Affiliation Dem 1% 28% 27% 35% 9%
Rep 24% 16% 22% 30% 8%
Ind 5% 3% 25% 54% 14%
Region Dark Red 10% 13% 35% 30% 13%
Light Red 12% 5% 10% 59% 15%
Swing 10% 28% 24% 34% 4%
Light Blue 10% 3% 12% 56% 19%
Dark Blue 9% 12% 11% 40% 27%
Methodology. Fielded December 2021 among 249 registered voters nationwide. Responses weighted by Demographics and Spectrum. Average expected error ±6.2%. See Why trust our polls? for the methodology, disclosures and accuracy record.

Expanding Medicare

Should Medicare be expanded to cover dental, vision, and hearing?

The answers as asked

Charts and tables use the short label at the start of each line.

  1. fully expand with these and more: Medicare should be expanded to fully cover dental, vision, and hearing, as well as all other medical costs currently not covered.
  2. fully cover dental, vision and hearing: Medicare should be expanded to fully cover dental, vision, and hearing.
  3. partially cover dental, vision and hearing: Medicare should be expanded to partially cover dental, vision, and hearing.
  4. stay as is: Medicare benefits should remain as is.
  5. reduced instead of expanded: Medicare benefits should be reduced instead of expanded.

The full crosstab table

ActiVote · Expanding Medicare · December 13, 2021
ActiVote 244 RV fully expand with these and more fully cover dental, vision and hearing partially cover dental, vision and hearing stay as is reduced instead of expanded
National ±6.3% MoE 56% 14% 9% 8% 14%
Gender Men 47% 11% 9% 12% 21%
Women 68% 18% 10% 1% 3%
Age 18-29 42% 17% 10% 6% 25%
30-49 61% 9% 9% 7% 15%
50-64 60% 15% 13% 9% 3%
65+ 65% 17% 0% 12% 6%
Ethnicity White 56% 21% 10% 4% 9%
Black 61% 12% 9% 8% 11%
Latino 44% 4% 20% 8% 25%
Education High school 68% 6% 4% 13% 10%
Some college 54% 17% 6% 5% 18%
Bachelor's 42% 20% 22% 5% 11%
Income <50k 66% 6% 6% 12% 10%
50k-100k 50% 17% 10% 7% 15%
>100k 51% 18% 11% 4% 16%
Affiliation Dem 59% 14% 9% 8% 10%
Rep 30% 9% 22% 19% 20%
Ind 63% 17% 0% 0% 19%
Region Dark Red 68% 21% 6% 0% 5%
Light Red 54% 7% 0% 22% 17%
Swing 46% 14% 20% 5% 15%
Light Blue 70% 8% 3% 6% 12%
Dark Blue 53% 21% 7% 4% 14%
Methodology. Fielded December 2021 among 244 registered voters nationwide. Responses weighted by Demographics and Spectrum. Average expected error ±6.3%. See Why trust our polls? for the methodology, disclosures and accuracy record.

Home Health Services

Should federal funding for home health services be increased, kept at current levels, or decreased?

The answers as asked

Charts and tables use the short label at the start of each line.

  1. discontinue federal funding: Federal funding of home health care services should be discontinued.
  2. decrease federal funding: Federal funding of home health care services should be decreased.
  3. keep at current levels: Federal funding of home health care services should remain at current levels.
  4. increase for those who cannot afford it: Federal funding of home health care services should be increased for those who cannot afford it.
  5. increase for everyone over 65: Federal funding of home health care services should be increased for everyone over 65.

The full crosstab table

ActiVote · Home Health Services · December 13, 2021
ActiVote 229 RV discontinue federal funding decrease federal funding keep at current levels increase for those who cannot afford it increase for everyone over 65
National ±6.5% MoE 10% 3% 14% 32% 39%
Gender Men 12% 5% 15% 29% 39%
Women 8% 1% 13% 37% 40%
Age 18-29 20% 5% 20% 28% 28%
30-49 12% 4% 7% 31% 47%
50-64 0% 3% 19% 46% 33%
65+ 6% 0% 15% 13% 65%
Ethnicity White 5% 3% 13% 42% 36%
Black 11% 6% 4% 35% 43%
Latino 15% 0% 26% 12% 48%
Education High school 12% 3% 16% 31% 39%
Some college 11% 3% 8% 35% 43%
Bachelor's 6% 4% 27% 30% 33%
Income <50k 10% 3% 11% 32% 44%
50k-100k 12% 5% 17% 27% 39%
>100k 9% 2% 15% 41% 33%
Affiliation Dem 9% 5% 0% 37% 49%
Rep 9% 3% 26% 27% 36%
Ind 8% 3% 28% 39% 22%
Region Dark Red 0% 0% 6% 52% 42%
Light Red 9% 5% 11% 36% 39%
Swing 10% 4% 26% 19% 41%
Light Blue 17% 1% 1% 33% 47%
Dark Blue 12% 3% 15% 39% 31%
Methodology. Fielded December 2021 among 229 registered voters nationwide. Responses weighted by Demographics and Spectrum. Average expected error ±6.5%. See Why trust our polls? for the methodology, disclosures and accuracy record.

Earned Income Tax Credit

Should the Earned Income Tax Credit be increased, stay as is, be reduced, or be abolished?

The answers as asked

Charts and tables use the short label at the start of each line.

  1. Increased to lift everyone out of poverty: The EITC should be increased to such a level that it lifts all working families above the poverty line.
  2. Increasing as part of overall strategy: Increasing the EITC is one of the tools (in combination with other programs) to provide relief for struggling families.
  3. Should stay as is: The EITC should stay approximately where it is today.
  4. Reduce EITC: We should reduce the overall cost of the EITC.
  5. Abolish EITC: The EITC should be abolished.

The full crosstab table

ActiVote · Earned Income Tax Credit · December 13, 2021
ActiVote 1433 RV Increased to lift everyone out of poverty Increasing as part of overall strategy Should stay as is Reduce EITC Abolish EITC
National ±2.6% MoE 40% 35% 9% 6% 10%
Gender Men 40% 30% 10% 8% 12%
Women 41% 41% 7% 3% 7%
Age 18-29 41% 38% 9% 6% 6%
30-49 46% 27% 10% 6% 11%
50-64 40% 30% 10% 5% 14%
65+ 31% 47% 4% 8% 11%
Ethnicity White 36% 37% 5% 8% 14%
Black 54% 32% 9% 0% 4%
Latino 39% 30% 9% 6% 16%
Education High school 42% 34% 8% 7% 9%
Some college 41% 34% 12% 6% 8%
Bachelor's 38% 37% 6% 5% 14%
Income <50k 39% 37% 9% 7% 8%
50k-100k 42% 33% 9% 6% 11%
>100k 40% 35% 8% 5% 11%
Affiliation Dem 43% 50% 4% 0% 3%
Rep 14% 39% 13% 14% 21%
Ind 51% 26% 12% 6% 5%
Region Dark Red 36% 40% 7% 4% 15%
Light Red 40% 28% 12% 11% 9%
Swing 41% 35% 6% 7% 11%
Light Blue 54% 27% 8% 2% 9%
Dark Blue 35% 42% 9% 6% 9%
Methodology. Fielded December 2021 among 1433 registered voters nationwide. Responses weighted by Demographics and Spectrum. Average expected error ±2.6%. See Why trust our polls? for the methodology, disclosures and accuracy record.

Pell Grants

Should Pell Grant eligibility be expanded to more people, kept as is, or restricted?

The answers as asked

Charts and tables use the short label at the start of each line.

  1. should be abolished: Pell Grants should be abolished.
  2. restricted to fewer people: Pell Grant eligibility should be restricted to fewer people.
  3. fine as is: Pell Grants are fine as is.
  4. expanded to more people: Pell Grant eligibility should be expanded to more people.
  5. universally available: Pell Grants should be universally available, independent of family income.

The full crosstab table

ActiVote · Pell Grants · December 13, 2021
ActiVote 219 RV should be abolished restricted to fewer people fine as is expanded to more people universally available
National ±6.6% MoE 12% 6% 18% 30% 33%
Gender Men 19% 2% 19% 26% 34%
Women 1% 13% 18% 36% 31%
Age 18-29 21% 7% 26% 20% 27%
30-49 7% 5% 14% 24% 49%
50-64 13% 2% 18% 43% 23%
65+ 7% 20% 15% 51% 7%
Ethnicity White 7% 9% 15% 45% 23%
Black 15% 0% 12% 15% 57%
Latino 33% 0% 5% 10% 51%
Education High school 6% 6% 24% 25% 40%
Some college 8% 5% 16% 28% 43%
Bachelor's 27% 10% 16% 40% 7%
Income <50k 6% 5% 21% 27% 40%
50k-100k 17% 5% 13% 34% 30%
>100k 13% 9% 22% 27% 29%
Affiliation Dem 8% 9% 10% 40% 33%
Rep 21% 5% 33% 24% 17%
Ind 6% 9% 23% 24% 38%
Region Dark Red 4% 0% 7% 47% 41%
Light Red 7% 0% 32% 22% 39%
Swing 27% 12% 22% 18% 21%
Light Blue 4% 0% 3% 35% 57%
Dark Blue 6% 12% 22% 39% 22%
Methodology. Fielded December 2021 among 219 registered voters nationwide. Responses weighted by Demographics and Spectrum. Average expected error ±6.6%. See Why trust our polls? for the methodology, disclosures and accuracy record.

Section 8 Housing Vouchers

Should funding for the Section 8 Housing Voucher program be increased, left as is, limited, or cancelled?

The answers as asked

Charts and tables use the short label at the start of each line.

  1. should be cancelled: This program should be cancelled as the problems it causes outweigh the benefits.
  2. limited to disabled, elderly and veterans: This program should be limited to the disabled, elderly and veterans.
  3. left as is: This program should be left as is.
  4. increase funding: This program should be continued with increased funding.
  5. fully funded to eliminate waiting lists: This program should be fully funded to ensure that the waiting lists are fully eliminated.

The full crosstab table

ActiVote · Section 8 Housing Vouchers · December 13, 2021
ActiVote 1525 RV should be cancelled limited to disabled, elderly and veterans left as is increase funding fully funded to eliminate waiting lists
National ±2.5% MoE 10% 27% 8% 19% 35%
Gender Men 13% 26% 10% 19% 32%
Women 7% 27% 7% 20% 39%
Age 18-29 14% 25% 12% 17% 32%
30-49 8% 29% 7% 17% 39%
50-64 8% 27% 9% 16% 39%
65+ 11% 27% 2% 34% 27%
Ethnicity White 10% 28% 9% 21% 32%
Black 4% 18% 7% 22% 49%
Latino 16% 30% 8% 15% 31%
Education High school 12% 25% 7% 19% 37%
Some college 10% 25% 6% 17% 41%
Bachelor's 9% 31% 12% 22% 27%
Income <50k 10% 27% 5% 21% 37%
50k-100k 12% 28% 11% 15% 34%
>100k 9% 25% 8% 22% 36%
Affiliation Dem 6% 15% 4% 28% 46%
Rep 14% 54% 7% 12% 13%
Ind 9% 19% 15% 23% 35%
Region Dark Red 3% 32% 8% 21% 36%
Light Red 11% 25% 7% 23% 34%
Swing 17% 32% 9% 12% 30%
Light Blue 9% 26% 5% 21% 39%
Dark Blue 9% 20% 12% 21% 38%
Methodology. Fielded December 2021 among 1525 registered voters nationwide. Responses weighted by Demographics and Spectrum. Average expected error ±2.5%. See Why trust our polls? for the methodology, disclosures and accuracy record.

Solar Tax Credits

Should solar tax credits be extended beyond their currently scheduled end in 2022?

We also asked this question once before:

The answers as asked

Charts and tables use the short label at the start of each line.

  1. extend indefinitely: Solar tax credits should be extended indefinitely.
  2. extend for 10+ years: Solar tax credits should be extended for at least another 10 years.
  3. taper off slowly after 2022: Solar tax credits should gradually taper off until a later date than 2022.
  4. end by 2022: Solar tax credits should follow their current trajectory to end by 2022.
  5. halted immediately: Solar tax credits should be halted immediately.

The full crosstab table

ActiVote · Solar Tax Credits · December 13, 2021
ActiVote 1201 RV extend indefinitely extend for 10+ years taper off slowly after 2022 end by 2022 halted immediately
National ±2.8% MoE 47% 29% 5% 9% 10%
Gender Men 47% 27% 4% 8% 14%
Women 46% 33% 6% 9% 5%
Age 18-29 45% 27% 9% 9% 11%
30-49 46% 36% 1% 9% 8%
50-64 43% 30% 8% 7% 13%
65+ 57% 22% 4% 10% 8%
Ethnicity White 54% 24% 4% 13% 6%
Black 56% 27% 8% 3% 6%
Latino 45% 31% 7% 5% 13%
Education High school 48% 25% 6% 10% 11%
Some college 50% 29% 4% 9% 9%
Bachelor's 42% 35% 7% 6% 11%
Income <50k 52% 23% 6% 3% 15%
50k-100k 40% 33% 5% 12% 9%
>100k 49% 32% 4% 10% 5%
Affiliation Dem 48% 41% 6% 3% 1%
Rep 32% 28% 8% 15% 17%
Ind 41% 31% 7% 9% 13%
Region Dark Red 50% 29% 4% 10% 7%
Light Red 52% 21% 5% 10% 12%
Swing 44% 38% 5% 7% 7%
Light Blue 45% 28% 8% 9% 10%
Dark Blue 44% 30% 4% 8% 14%
Methodology. Fielded December 2021 among 1201 registered voters nationwide. Responses weighted by Demographics and Spectrum. Average expected error ±2.8%. See Why trust our polls? for the methodology, disclosures and accuracy record.

Rural Development

Should we invest in creating job opportunities in rural communities, or leave rural development to the market?

The answers as asked

Charts and tables use the short label at the start of each line.

  1. heavily invest for all rural communities: We should heavily invest in creating job opportunities for all rural communities.
  2. heavily invest for least developed rural communities: We should heavily invest in creating job opportunities for the least developed rural communities.
  3. promote investment in least developed rural communities: We should promote investment in creating job opportunities in the least developed rural communities.
  4. leave to the market: The development of rural communities should be left to the market.
  5. shift from rural to urban is fine: A shift from rural to urban opportunity is perfectly fine and does not need any action.

The full crosstab table

ActiVote · Rural Development · December 13, 2021
ActiVote 922 RV heavily invest for all rural communities heavily invest for least developed rural communities promote investment in least developed rural communities leave to the market shift from rural to urban is fine
National ±3.2% MoE 37% 12% 30% 17% 3%
Gender Men 34% 13% 33% 16% 4%
Women 41% 12% 27% 18% 2%
Age 18-29 32% 16% 28% 19% 5%
30-49 52% 10% 23% 13% 3%
50-64 35% 11% 34% 16% 4%
65+ 23% 14% 42% 21% 0%
Ethnicity White 40% 7% 23% 24% 6%
Black 40% 11% 44% 5% 0%
Latino 35% 19% 22% 22% 2%
Education High school 43% 14% 25% 16% 2%
Some college 37% 16% 30% 12% 5%
Bachelor's 30% 6% 37% 25% 3%
Income <50k 34% 17% 29% 17% 4%
50k-100k 43% 14% 29% 12% 2%
>100k 34% 5% 33% 24% 4%
Affiliation Dem 41% 17% 34% 6% 2%
Rep 32% 14% 23% 29% 2%
Ind 27% 8% 39% 23% 4%
Region Dark Red 35% 20% 20% 20% 4%
Light Red 50% 8% 24% 15% 3%
Swing 24% 10% 40% 24% 2%
Light Blue 47% 12% 28% 11% 3%
Dark Blue 32% 14% 36% 15% 3%
Methodology. Fielded December 2021 among 922 registered voters nationwide. Responses weighted by Demographics and Spectrum. Average expected error ±3.2%. See Why trust our polls? for the methodology, disclosures and accuracy record.

Tax Gap

Should the government do more, through legislation or more funding for the IRS, to close the tax gap?

The answers as asked

Charts and tables use the short label at the start of each line.

  1. legislate to aggressively close the tax gap: The government should enact more legislation to aggressively close the tax gap.
  2. more funding to IRS to close the tax gap: The government should provide significantly more funding to the IRS to close the tax gap.
  3. focus on low-hanging fruit: The government should focus on closing the tax gap on the ΓÇ£low-hanging fruitΓÇ¥.
  4. current situation is fine: The current funding of the IRS and legislation are sufficient.
  5. less focus on tax gap: The government should put less focus on the tax gap.

The full crosstab table

ActiVote · Tax Gap · December 13, 2021
ActiVote 348 RV legislate to aggressively close the tax gap more funding to IRS to close the tax gap focus on low-hanging fruit current situation is fine less focus on tax gap
National ±5.3% MoE 46% 24% 13% 7% 11%
Gender Men 38% 22% 15% 9% 15%
Women 57% 26% 10% 3% 4%
Age 18-29 44% 26% 11% 4% 15%
30-49 42% 16% 21% 6% 15%
50-64 46% 34% 7% 11% 3%
65+ 61% 16% 9% 7% 6%
Ethnicity White 40% 29% 12% 7% 13%
Black 45% 24% 18% 6% 9%
Latino 48% 19% 11% 9% 13%
Education High school 56% 25% 11% 1% 7%
Some college 37% 24% 17% 9% 13%
Bachelor's 43% 21% 11% 12% 13%
Income <50k 52% 18% 15% 4% 12%
50k-100k 54% 16% 7% 13% 10%
>100k 28% 40% 19% 2% 11%
Affiliation Dem 39% 34% 10% 10% 7%
Rep 38% 18% 13% 9% 22%
Ind 46% 14% 24% 5% 11%
Region Dark Red 44% 22% 12% 12% 10%
Light Red 54% 27% 8% 0% 11%
Swing 45% 21% 14% 9% 10%
Light Blue 51% 19% 16% 6% 7%
Dark Blue 38% 28% 14% 6% 14%
Methodology. Fielded December 2021 among 348 registered voters nationwide. Responses weighted by Demographics and Spectrum. Average expected error ±5.3%. See Why trust our polls? for the methodology, disclosures and accuracy record.

Global Minimum Tax

Should there be a global minimum corporate tax rate, or should countries compete on tax rates?

The answers as asked

Charts and tables use the short label at the start of each line.

  1. binding global minimum tax for all countries: There should be a binding global minimum tax rate for all countries in the world.
  2. global minimum tax for all developed countries: There should be a global minimum tax rate agreed to by all developed countries.
  3. global minimum tax for all multinationals: There should be a global minimum tax rate but only applicable to multinationals.
  4. current situation is fine: The current situation is fine.
  5. countries should compete more on taxes: Countries should compete more in seeking lower corporate taxes.

The full crosstab table

ActiVote · Global Minimum Tax · December 13, 2021
ActiVote 287 RV binding global minimum tax for all countries global minimum tax for all developed countries global minimum tax for all multinationals current situation is fine countries should compete more on taxes
National ±5.8% MoE 40% 17% 7% 12% 26%
Gender Men 38% 11% 6% 16% 30%
Women 42% 25% 8% 6% 20%
Age 18-29 40% 23% 3% 13% 21%
30-49 37% 15% 12% 9% 28%
50-64 42% 10% 5% 17% 26%
65+ 47% 18% 0% 7% 28%
Ethnicity White 44% 21% 11% 6% 18%
Black 33% 21% 0% 20% 26%
Latino 38% 8% 4% 4% 46%
Education High school 37% 17% 4% 17% 25%
Some college 40% 16% 3% 13% 28%
Bachelor's 43% 16% 16% 2% 23%
Income <50k 32% 11% 6% 21% 29%
50k-100k 47% 11% 11% 9% 22%
>100k 42% 28% 2% 3% 24%
Affiliation Dem 50% 20% 6% 10% 13%
Rep 22% 6% 7% 19% 45%
Ind 56% 14% 6% 16% 8%
Region Dark Red 42% 5% 21% 2% 30%
Light Red 29% 14% 6% 27% 25%
Swing 42% 14% 4% 13% 27%
Light Blue 59% 18% 0% 0% 23%
Dark Blue 31% 28% 9% 8% 24%
Methodology. Fielded December 2021 among 287 registered voters nationwide. Responses weighted by Demographics and Spectrum. Average expected error ±5.8%. See Why trust our polls? for the methodology, disclosures and accuracy record.

SCR 14 (Reconciliation Bill)

How would you vote on SCR 14, the reconciliation bill?

We also asked this question once before:

The answers as asked

Charts and tables use the short label at the start of each line.

  1. Yes: Yes
  2. Unsure: Unsure
  3. No: No

The full crosstab table

ActiVote · SCR 14 (Reconciliation Bill) · December 13, 2021
ActiVote 497 RV Yes Unsure No
National ±4.4% MoE 52% 9% 38%
Gender Men 47% 6% 46%
Women 58% 13% 29%
Age 18-29 52% 11% 37%
30-49 59% 10% 31%
50-64 51% 4% 45%
65+ 42% 15% 44%
Ethnicity White 48% 11% 41%
Black 57% 5% 39%
Latino 48% 11% 41%
Education High school 62% 4% 34%
Some college 53% 11% 36%
Bachelor's 41% 12% 47%
Income <50k 40% 16% 44%
50k-100k 58% 7% 34%
>100k 56% 6% 38%
Affiliation Dem 76% 9% 15%
Rep 11% 11% 78%
Ind 46% 11% 43%
Region Dark Red 46% 14% 41%
Light Red 46% 6% 48%
Swing 53% 6% 40%
Light Blue 46% 12% 42%
Dark Blue 63% 11% 26%
Methodology. Fielded December 2021 among 497 registered voters nationwide. Responses weighted by Demographics and Spectrum. Average expected error ±4.4%. See Why trust our polls? for the methodology, disclosures and accuracy record.

H.R. 5376 (Build Back Better Act)

How would you vote on H.R. 5376, the Build Back Better Act?

The answers as asked

Charts and tables use the short label at the start of each line.

  1. Yes: Yes
  2. Unsure: Unsure
  3. No: No

The full crosstab table

ActiVote · H.R. 5376 (Build Back Better Act) · December 13, 2021
ActiVote 430 RV Yes Unsure No
National ±4.7% MoE 58% 8% 34%
Gender Men 50% 7% 43%
Women 67% 9% 24%
Age 18-29 51% 11% 37%
30-49 61% 7% 32%
50-64 61% 4% 35%
65+ 63% 9% 28%
Ethnicity White 65% 6% 29%
Black 59% 27% 14%
Latino 53% 10% 37%
Education High school 60% 2% 37%
Some college 54% 7% 39%
Bachelor's 62% 16% 22%
Income <50k 54% 6% 39%
50k-100k 60% 9% 32%
>100k 60% 9% 31%
Affiliation Dem 93% 0% 7%
Rep 19% 8% 72%
Ind 58% 10% 32%
Region Dark Red 40% 14% 46%
Light Red 50% 5% 45%
Swing 58% 8% 34%
Light Blue 75% 3% 23%
Dark Blue 63% 10% 27%
Methodology. Fielded December 2021 among 430 registered voters nationwide. Responses weighted by Demographics and Spectrum. Average expected error ±4.7%. See Why trust our polls? for the methodology, disclosures and accuracy record.