
Private Sector Labor Unions
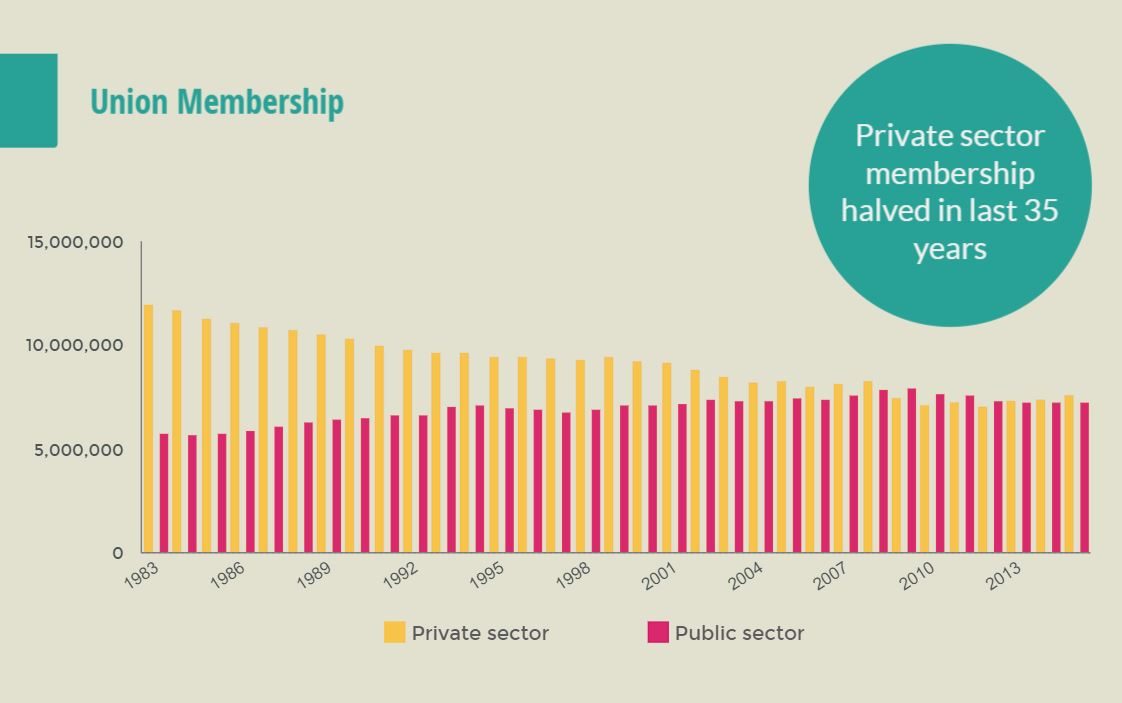
President Joe Biden has been overtly pro-union his entire career and has not changed his tune since he took office. By the end of April 2021, he established a White House Task Force on Worker Organizing and Empowerment to ensure that his agenda is enacted. At the same time, a recent attempt to unionize an Amazon warehouse in Alabama failed with 70% of the votes cast against unionizing.
We wondered what the country thinks about private sector labor unions. We asked theActiVote users the question and gave them five answers to pick from:
- All sectors of the economy should have unions that create collective bargaining agreements that should be binding for all employers.
- Unions and union membership should be encouraged around the country.
- No change is needed at this time.
- The power of private sector unions should be restricted.
- All private sector labor unions should be abolished.
It turns out that a large minority (42%) of people believe that we should have unions everywhere, and another 25% believe that we should at least encourage union membership. Only 19% believe that we should actively try to reduce union membership, or even abolish unions outright.
Elderly voters (65+) are most supportive of unions. As in most cases they have their working days behind them, this is likely a reflection of the roles unions played in their working lives and not so much them expressing a self interest.
The middle income category ($50k-$100k) are the strongest union supporters with a 52% majority supporting union membership all around the country in every sector of the economy, with only 6% wishing for the abolishment of all unions. Those earning less than $50k are less supportive, with 37% for unions everywhere and 17% for abolishing all unions. Perhaps this can be explained by the fact that most union members are earners in the $50k-$100k category.
There is a significant difference between the parties: virtually all Democrats (85%) would like to see union membership expanded and only 5% wishing to reduce union membership, while more Republicans (45%) wish to see the power of unions reduced and only 38% wishes unions to be strengthened.
Based on our polling it is not surprising that the Protecting the Right to Organize Act (H.R. 842), pro-union legislation supported by the Biden administration, passed the House of Representatives in March on a mostly partisan basis, with most Democrats voting for and most Republicans voting against. It is expected to be filibustered in the Senate.
Therefore, don’t expect any bipartisan legislation on this topic anytime soon. Instead, those who wish to unionize will have to do it one warehouse at the time. If they can get the votes.