
Poll on Age Limits for Elected Officials
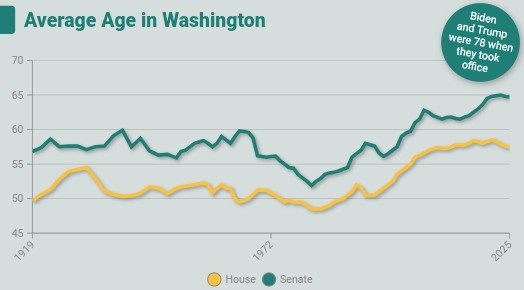
Joe Biden was the oldest president inaugurated to a first term at the age of 78 years and 2 months. He sought reelection at the age of 82 until he dropped out just 107 days before the general election in 2024. Donald Trump is the oldest president inaugurated to a second term at the age of 78 years and 7 months. Chuck Grassley, U.S. Senator for Iowa is 92, while Bernie Sanders, U.S. Senator for Vermont is 84 and seeking reelection for another 6-year term in 2026. In 2023, Diane Feinstein, U.S. Senator for California died in office at the age of 90.
The many examples of aging elected officials begs the question whether there should be age limits for elected officials. The constitution currently lists minimum ages for federal elected officials (25 for the House, 30 for the Senate and 35 for President), but does not list maximum ages.
We wondered what the American people would think of age limits for elected federal officials. So, we asked 487 registered voters (MoE of 4.4%) in December, 2025 about it:
Which of the following best reflects your opinion on age limits for federal elected officials?
- No age limits.
- Require cognitive tests above a certain age.
- Maximum age of 85.
- Maximum age of 80.
- Maximum age of 75.
The national electorate, overwhelmingly, believes that the current situation (no age limits) is undesirable. Only 12% believe that there should be no age limits. The remaining 88% are approximately evenly divided between a specific age limit (46%) and requiring cognitive tests above a certain age (42%). Of those who prefer a specific age, a large majority believes that 75 should be the age limit, while only 6% chose 80 and just 1% chose 85.
There seems to be agreement from left to right on this topic, with only small differences between the (moderate) left and the (moderate) right. On the left there is more focus on setting a specific age limit (of 75), while on the right there is more focus on cognitive testing.
Perhaps somewhat surprisingly, it is especially the eldest participants to our poll that recognize the challenges that advanced age may bring: those 65 and older are most supportive of the 75-year limit, while being the least likely to believe that no changes are needed in the current system. Perhaps they know better than anyone else that age comes with challenges.
In summary, addressing the age limit issue can count on large majority support, with the key challenge to determine whether we should seek a specific age limit for all (probably 75) or use cognitive tests to determine who should be eligible.
See here for more details on ActiVote’s polls.