Online Voting Survey
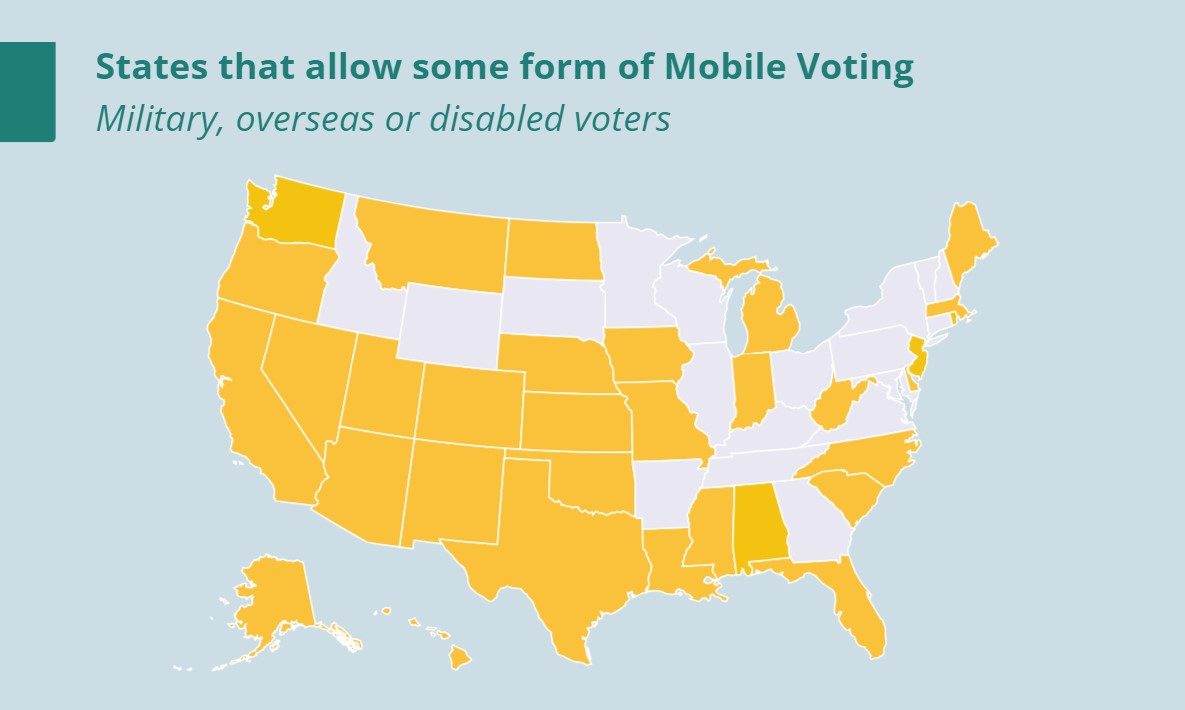
ActiVote has conducted a survey in the ActiVote app in 2024 to determine what the American people think about mobile voting. The 881 people who weighed in between September 17, 2024 and November 26, 2024, chose between 5 possible options:
- Online voting should not be available to any voter.
- Online voting should be restricted to very few exceptions, such military personnel serving overseas.
- Online voting should, over time, be available for voters in certain elections, such as local elections and primaries.
- Online voting should, over time, be expanded to more groups, such as those normally voting absentee.
- Online voting should, over time, be available for all voters in all elections.
In the following graphs these answers have been abbreviated to:
- Banned
- Only military and overseas
- Limited groups
- Expanded
- Universal
Results
There is a clear majority (71%) for doing something with online voting, as only 29% wish it completely banned. However, there is only a minority (37%) who is open to, over time, making it universal. Of the 34% who wish to allow it in some restricted form, most believe it should only apply to military serving overseas.
Support is largest among both rural and urban voters. It is unclear why suburban voters are especially negative about mobile voting compared to their rural and urban counterparts. One could speculate that urban voters are positive, as they are typically less conservative, while rural voters may more often have to travel longer distances in order to vote and therefore might personally believe that they could benefit from mobile voting.
The group that is most positive about mobile voting are those 50-64 of age. It is unclear why especially this group would be more open to it.
Women are more supportive of mobile voting than men, which could easily be linked to men typically being a bit more conservative than women.
There is a clear party split: Democrats are in majority in favor of ultimately moving to universal mobile voting, while a plurality of Republicans favor banning it outright, and 74% are against any usage beyond overseas military. Independents are in between Democrats and Republicans.
Especially Latinos support mobile voting, followed by Blacks. Whites are the least open to mobile voting.
Weighting
The following table shows for every subcategory of voters what the unweighted participation in our poll was, as well as the participation after weighting to correctly reflect the national electorate.
From the table it can be seen that there was overrepresentation of rural and suburban voters, younger voters (18-49), male voters, Democrats, White voters, low income and high income voters, and those having a college education.
After weighting, however, the poll correctly represented the national electorate.
Methodology
Check out our polling page for our latest election polls, and Why trust our polls? for our methodology, disclosures and accuracy record.
 | 790 RV | Weighted | Banned | Only military and overseas | Limited Groups | Expanded | Universal |
|---|---|---|---|---|---|---|---|
| National | ±3.5% MoE | 100% | 30% | 22% | 8% | 3% | 37% |
| Region | rural | 33% | 26% | 24% | 6% | 4% | 39% |
| suburban | 32% | 40% | 21% | 8% | 1% | 30% | |
| urban | 35% | 22% | 21% | 10% | 4% | 42% | |
| Age | 18-29 | 16% | 28% | 20% | 9% | 6% | 37% |
| 30-49 | 32% | 35% | 24% | 4% | 2% | 35% | |
| 50-64 | 24% | 22% | 22% | 6% | 5% | 46% | |
| 65+ | 28% | 33% | 21% | 15% | 1% | 30% | |
| Gender | F | 53% | 24% | 22% | 8% | 3% | 43% |
| M | 47% | 37% | 22% | 8% | 3% | 30% | |
| Affiliation | D | 40% | 19% | 15% | 12% | 2% | 52% |
| R | 30% | 46% | 27% | 7% | 3% | 17% | |
| I | 28% | 25% | 25% | 5% | 5% | 39% | |
| Ethnicity | White | 69% | 31% | 22% | 7% | 4% | 37% |
| Black | 11% | 22% | 17% | 17% | 0% | 43% | |
| Latino | 13% | 18% | 14% | 15% | 3% | 49% | |
| Income | Low | 22% | 24% | 25% | 3% | 4% | 43% |
| Middle | 42% | 29% | 20% | 11% | 2% | 39% | |
| High | 36% | 34% | 23% | 8% | 4% | 30% | |
| Education | Highschool | 33% | 30% | 20% | 5% | 3% | 42% |
| Some College | 23% | 31% | 20% | 12% | 2% | 35% | |
| BSC+ | 44% | 30% | 25% | 9% | 4% | 33% |