
ActiVote
← All analysis
November 9, 2020

Legalizing Recreational Marijuana
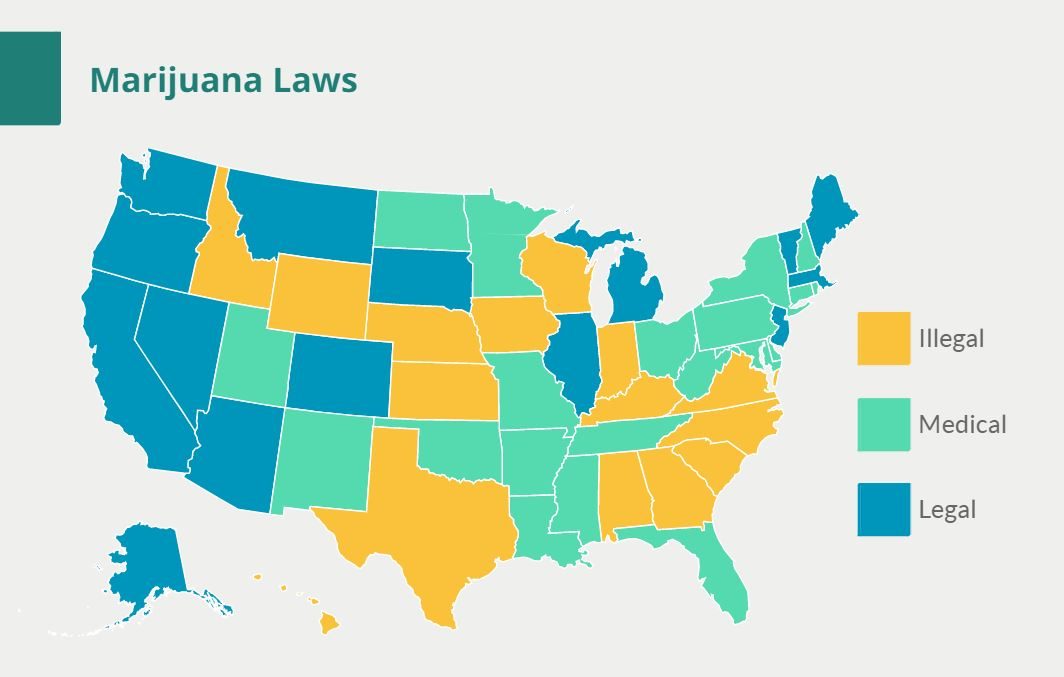
During the November 3rd, 2020 elections five states had measures on the ballot involving marijuana and all five of them passed. Four states, Arizona, Montana, New Jersey and South Dakota legalized marijuana for recreational use, joining 11 other states and DC. Mississippi has now voted to allow marijuana for medical use.

These measures increase the pressure on the federal government to resolve this issue nationally and to avoid a situation that state law and federal law are increasingly in conflict with each other.

We conducted a survey to see what our users are thinking of legalizing recreational marijuana. The answers that our users could choose from can roughly be summarized as

  • Should be legal and all related criminal records should be expunged.
  • Should be legal, with some regulations and taxes applied.
  • Should be left to the states.
  • Should be illegal but downgraded from a schedule I drug
  • Should remain a schedule I drug.
The headline result
legal and records expunged
59%
legal with regulations
31%
left to the states
5%
illegal but consider downgrade from schedule I
3%
remain schedule I drug
2%
See the details below →

We found that a 59% majority supports legalization and expunging related criminal records. That majority increases to 90% if we include the group that is for legalization with regulation.

If we look at any breakdown by age, income, ethnicity or education we see the same pattern. In every single category at least 50% support legalization and expunging criminal records and at least 80% supports legalization if it comes with some regulation.

The crosstabs
Dem
58%
35%
Rep
35%
38%
16%
Ind
68%
29%
legal and records expungedlegal with regulationsleft to the statesillegal but consider downgrade from schedule Iremain schedule I drug
See the details below →

There is only one exception. Republicans are a bit more hesitant than other groups to legalize marijuana and expunge all related criminal records, with about 1 in 3 supporting it. Still, almost 3 in 4 support legalization if it includes regulation and taxation.

With these amounts of bipartisan support for legalization, it is not surprising that more and more legislatures either enact legislation or have their constituents do it for them through ballot measures. Perhaps the new administration can put this on the list of “Things to do with bipartisan support”.

The Details

The answers as asked

Charts and tables use the short label at the start of each line.

  1. legal and records expunged: Marijuana should be legal and marijuana related convictions should be expunged.
  2. legal with regulations: Marijuana should be legal with high taxes and age requirements like alcohol and tobacco.
  3. left to the states: Marijuana legalization ought to be decided on the state level.
  4. illegal but consider downgrade from schedule I: Marijuana should remain illegal across the US, though the government should consider downgrading its status from schedule I.
  5. remain schedule I drug: Marijuana should remain a schedule I drug, and states who have legalized it are rightfully subject to the authority of the DEA (Drug Enforcement Administration).

The full crosstab table

ActiVote · Recreational Marijuana · November 9, 2020
ActiVote 917 RV legal and records expunged legal with regulations left to the states illegal but consider downgrade from schedule I remain schedule I drug
National ±3.2% MoE 59% 31% 5% 3% 2%
Gender Men 60% 29% 7% 4% 1%
Women 59% 32% 4% 2% 3%
Age 18-29 60% 32% 5% 2% 0%
30-49 65% 23% 4% 6% 2%
50-64 54% 34% 5% 1% 5%
65+ 55% 35% 9% 1% 0%
Ethnicity White 59% 25% 10% 3% 3%
Black 57% 34% 2% 6% 1%
Latino 70% 24% 4% 2% 0%
Education High school 65% 29% 3% 2% 0%
Some college 55% 34% 5% 4% 2%
Bachelor's 59% 29% 7% 2% 3%
Income <50k 65% 28% 3% 4% 0%
50k-100k 60% 29% 7% 4% 1%
>100k 55% 34% 6% 2% 4%
Affiliation Dem 58% 35% 3% 4% 0%
Rep 35% 38% 16% 6% 5%
Ind 68% 29% 2% 0% 2%
Region Dark Red 60% 31% 6% 1% 2%
Light Red 66% 24% 7% 3% 0%
Swing 53% 38% 5% 3% 1%
Light Blue 57% 22% 7% 8% 6%
Dark Blue 62% 33% 3% 1% 1%
Methodology. Fielded November 2020 among 917 registered voters nationwide. Responses weighted by Demographics and Spectrum. Average expected error ±3.2%. See Why trust our polls? for the methodology, disclosures and accuracy record.