
ActiVote
← All analysis
September 17, 2021

Infrastructure Week Results

Introduction

As part of the Infrastructure Week ActiVote event, run in the ActiVote app from August 31st-September 16th, 2021, a poll on 11 topics, 2 bills, and 1 procedure question was executed.
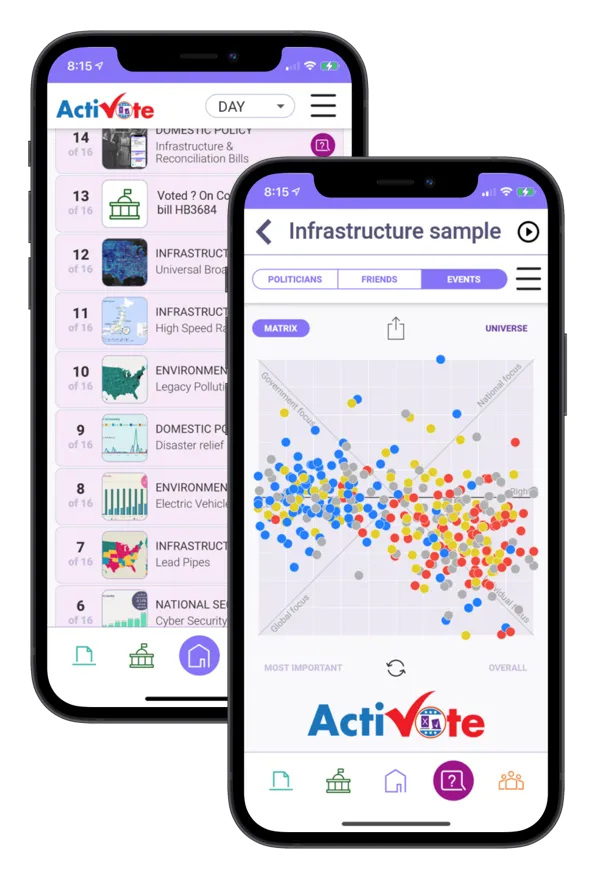
The two bills were H.R. 3684 “INVEST in America Act” and SCR 14, the “$3.5T Reconciliation Bill”. Each bill consisted of title, summary description, link to the full bill text, and the votes cast by a participant’s representatives as well as the overall votes cast in Congress. The three choices available to users were “Yea”, “Nay” and “Unsure”.

The procedure question asked in how far representatives were expected to vote their conscience on these bills.

The total number of answers included in this poll is 19,924, averaging a response rate of 1423 per poll.

Polling Results Per Topic

In this chapter we are presenting the polling results per topic

Cyber Security

There is significant majority support (70%) for extra investments in cyber security, with minimal support (10%) for doing less on cyber security than we are doing today.

Cyber Security — the headline result
At least doubled
27%
higher % than other nations
43%
fine as is
20%
similar to other nations
4%
cut to minimum
6%
See the details below →

Cyber Security is a very much bipartisan issue with 79% of Democrats, 72% of Republicans and 67% of Independents supporting additional investments.

Cyber Security — the crosstabs
Dem
29%
50%
14%
Rep
28%
44%
25%
Ind
28%
39%
20%
At least doubledhigher % than other nationsfine as issimilar to other nationscut to minimum
See the details below →

Disaster Relief

A significant majority of 75% of voters believe that the federal government should provide significant disaster aid if and when individual states need it. Only 15% of voters believe that the federal government should hold back on disaster aid and only focus on infrastructure.

Disaster Relief — the headline result
disaster aid as needed
55%
mostly aid as needed
20%
split between infrastructure and aid
11%
mostly infrastructure
12%
only infastructure
3%
See the details below →

Disaster Relief is a very bipartisan issue with 78% of Democrats, 74% of independents and 68% of Republicans supporting providing significant aid to states if and when they need it.

Disaster Relief — the crosstabs
Dem
52%
26%
12%
10%
Rep
52%
16%
9%
17%
Ind
50%
24%
15%
11%
disaster aid as neededmostly aid as neededsplit between infrastructure and aidmostly infrastructureonly infastructure
See the details below →

Electric Vehicles

A significant majority of 70% belief that Electric Vehicles should be encouraged, while only 5% believes they should be discouraged. Of those who would like to encourage Electric Vehicles, they are split in how strong that encouragement should be: 31% believe that some incentives should be given to promote them, 17% believe that we should ensure that by 2030 half of all vehicles will be electric, while 22% would like to mandate Electric Vehicles as soon as possible.

Electric Vehicles — the headline result
mandate all electric ASAP
22%
50% by 2030
17%
some incentives
31%
neither encourage nor discourage
25%
discourage electric vehicles
5%
See the details below →

There are some clear partisan differences on this topic: Democrats (80%) and Independents (82%) favor encouraging Electric Vehicles, while only a small majority of Republicans (54%) feel the same way. Republican’s largest subgroup (43%) consists of those who wish to leave it to the market.

Electric Vehicles — the crosstabs
Dem
21%
23%
36%
15%
Rep
13%
33%
43%
Ind
13%
30%
39%
13%
mandate all electric ASAP50% by 2030some incentivesneither encourage nor discouragediscourage electric vehicles
See the details below →

High-Speed Rail

A majority of 72% believes that we should do more on high-speed rail than we are doing today. A plurality of 38% even believes that we should set up a nation-wide high-speed rail network. Less than 1 in 10 believes we should not invest in high-speed rail at all.

High-Speed Rail — the headline result
should not invest
9%
left to the states
20%
encourage high speed rail
12%
build between large centers
22%
nation-wide high speed rail
38%
See the details below →

Democrats (88%) and Independents (79%) believe high-speed rail needs to be encouraged, and 75% of Democrats and 68% of Independents believe we should at least connect large population centers. Republicans are less supportive of high-speed rail: although exactly half (50%) would like to encourage it, only 33% want to build high-speed rail connections between large population centers.

High-Speed Rail — the crosstabs
Dem
13%
27%
48%
Rep
9%
41%
17%
17%
16%
Ind
15%
11%
25%
43%
should not investleft to the statesencourage high speed railbuild between large centersnation-wide high speed rail
See the details below →

Lead Pipes

A majority (78%) believes that the federal government should at least upgrade all lead pipes on public property. A majority of 65% wishes to go further and have the government help upgrade private property owners who cannot afford it themselves.

Lead Pipes — the headline result
should play no role
9%
only act with clear deterioration
13%
upgrade on public property
13%
upgrade public and private for those who cannot afford
37%
upgrade all lead pipes
28%
See the details below →

The partisan split on this topic is limited: 83% of Democrats supports upgrading all lead pipes on public property, along with 84% of Independents and 65% of Republicans. There is majority support for upgrading lead pipes for private property owners who cannot afford it from Democrats (76%) and Independents (59%) but support falls just short of a majority among Republicans (48%)

Lead Pipes — the crosstabs
Dem
10%
46%
30%
Rep
14%
21%
17%
30%
18%
Ind
10%
25%
32%
27%
should play no roleonly act with clear deteriorationupgrade on public propertyupgrade public and private for those who cannot affordupgrade all lead pipes
See the details below →

Legacy Pollution Cleanup

A small majority of (56%) believes that the government should make funds available to cleanup legacy pollution sites. The minority believes that cleanup should be linked to whether the polluters can be made to pay (26%), or should proceed, but not as a priority (17%).

Legacy Pollution Cleanup — the headline result
no priority at all
2%
proceed, but no priority
17%
cleanup, if polluters pay
26%
significant funding in bill
36%
top priority with more funding than in bill
20%
See the details below →

Democrats (68%) and Independents (67%) in majority favor significant funding for cleaning up legacy pollution sites. Republicans not so much: about 1/3 favors such funding, another 1/3 wishes to make cleanup dependent on whether the polluters pay, and the final 1/3 does not see it as a priority.

Legacy Pollution Cleanup — the crosstabs
Dem
13%
19%
52%
16%
Rep
33%
31%
27%
Ind
12%
18%
41%
26%
no priority at allproceed, but no prioritycleanup, if polluters paysignificant funding in billtop priority with more funding than in bill
See the details below →

Ports

As majority of 58% wishes to provide additional funding for our ports, while 32% wishes that ports become less dependent on the federal government or even privatize all ports.

Ports — the headline result
$37 billion
41%
more than the current $22 billion
17%
keep funding as is
10%
less dependency on federal government
19%
privatize all ports
13%
See the details below →

Most Democrats (80%) would like to increase the funding for ports. Only a minority of Independents (45%) and Republicans (43%) agree. Similar numbers of them would like to ports be less dependent on the federal government.

Ports — the crosstabs
Dem
60%
22%
10%
Rep
19%
24%
18%
27%
12%
Ind
34%
11%
37%
12%
$37 billionmore than the current $22 billionkeep funding as isless dependency on federal governmentprivatize all ports
See the details below →

Power Grid Vulnerability

A large majority of 90% would like to see investments to reduce the vulnerability of the power grid.

Power Grid Vulnerability — the headline result
invest with highest priority
53%
invest, but not highest priority
37%
some limited funding
1%
research issue, but no investment just yet
6%
is not an issue
3%
See the details below →

Democrats (93%), Independents (90%) and Republicans (88%) are in complete agreement regarding the necessity to address the vulnerability of the power grid.

Power Grid Vulnerability — the crosstabs
Dem
56%
37%
Rep
56%
32%
9%
Ind
35%
55%
invest with highest priorityinvest, but not highest prioritysome limited fundingresearch issue, but no investment just yetis not an issue
See the details below →

Public Transportation

A significant majority of 77% would like to see investments in public transport, while a smaller majority of 56% would like to see heavy investments all around the nation.

Public Transportation — the headline result
heavily invest in both rural and urban
56%
improve operations and service
21%
left to market
8%
decrease subsidies
7%
government should get out of public transport
8%
See the details below →

Investments in Public Transportation is important to virtually all Democrats (96%), a large majority of Independents (89%) and a smaller majority of Republicans (60%). A small group of 15% of Republicans believes that government should have no role in public transportation at all.

Public Transportation — the crosstabs
Dem
75%
21%
Rep
31%
29%
18%
15%
Ind
68%
21%
heavily invest in both rural and urbanimprove operations and serviceleft to marketdecrease subsidiesgovernment should get out of public transport
See the details below →

Roads & Bridges

A large majority of 77% believes that additional money should go to shore up our roads and bridges and 2 out of 3 voters believe that roads & bridges are due a major investment.

Roads & Bridges — the headline result
major investment, up to standard
66%
additional money to make them safe
11%
some money now, but then left to states
14%
minimum necessary to make them safe
1%
no extra money
7%
See the details below →

There is little partisan divide on this topic: 80% of Democrats, 72% of independents and 56% of republicans support a major investment. If we include those who support at least additional money to all roads and bridges safe, these numbers increase by about 10%.

Roads & Bridges — the crosstabs
Dem
80%
9%
Rep
56%
10%
21%
Ind
72%
11%
12%
major investment, up to standardadditional money to make them safesome money now, but then left to statesminimum necessary to make them safeno extra money
See the details below →

Want to read more about American’s opinions on roads & bridges. Check out our previous analysis here.

Universal Broadband Access

The country is divided on what to do about Universal Broadband Access. On the opposite sides of the spectrum, 30% believes that the government should create a national internet, while 26% believe that it should be left completely to private business. Among the other options, 19% believe loans and grants from the FCC are the way to go to stimulate the creation of broadband access. Another 14% believes that it should be left to local municipalities. A final 10% thinks that the government should provide at least internet access at libraries and government buildings.

Universal Broadband Access — the headline result
national internet by government
30%
loans and grants from FCC
19%
local municipalities for their communities
14%
internet at libraries and government buildings
10%
leave to private business
26%
See the details below →

There is a clear partisan divide, but even among Democrats there is only a minority for a major government undertaking to provide a nationwide internet, something supported by only 29% of independents and 24% of Republicans. Loans and grants from the FCC are more popular with Democrats (25%) and Independents (23%) than Republicans (23%). A plurality of Republicans (37%) would like to just leave it to private businesses.

Universal Broadband Access — the crosstabs
Dem
42%
25%
15%
10%
Rep
24%
15%
14%
10%
37%
Ind
29%
23%
15%
12%
21%
national internet by governmentloans and grants from FCClocal municipalities for their communitiesinternet at libraries and government buildingsleave to private business
See the details below →

Want to read more about American’s opinions on universal broadband, check out our previous analysis here.

H.R. 3684: “The INVEST in America Act”

Overall, the bipartisan bill (passed 69-31 in the Senate) is popular among voters: 61% would vote “Yes”, while only 29% would vote “No”, with 1 in 10 voters unsure about where they stand.

H.R. 3684 — the headline result
Yes
61%
Unsure
10%
No
29%
See the details below →

Democrats are almost unanimous (88%) in their support for the bill with only 11% against. Independents are also clearly supportive of the bill (69% vs. 16%). While 30% of Republicans support the bill, a 55% majority is against.

H.R. 3684 — the crosstabs
Dem
88%
11%
Rep
30%
15%
55%
Ind
69%
15%
16%
YesUnsureNo
See the details below →

SCR14: “$3.5T Reconciliation Bill”

The country is divided on the $3.5T reconciliation bill, with a very slight edge (47%-46%) for passage.

SCR 14: “$3.5T Reconciliation Bill” — the headline result
Yes
47%
Unsure
7%
No
46%
See the details below →

The partisan divide on this bill is very clear: 85% of Democrats are for, and 11% against, while for Republicans it is the other way around: 82% is against, with only 10% for. Independents are almost evenly divided with 44% for and 41% against.

SCR 14: “$3.5T Reconciliation Bill” — the crosstabs
Dem
85%
11%
Rep
10%
82%
Ind
44%
16%
41%
YesUnsureNo
See the details below →

Representatives Approach to Voting on Both Bills

A majority of all voters (56%) believe that their representatives should just vote their conscience on both bills. Another 16% feels that you can use your vote as leverage, but ultimately should still vote your conscience. There is little support for gamesmanship leading to voting against a bill that a representative supports.

Voting on Both Bills — the headline result
do anything to get your way
13%
could vote against one they support if unhappy with the other
10%
use threat to vote against to get your way
6%
use leverage, but vote conscience
16%
vote conscience on both bills
56%
See the details below →

Independents are most clear about expecting their representatives to vote their conscience: 87% would like to see that, allowing for using some leverage before ultimately voting. Republicans are closely behind with 79% sharing this opinion. While a (much smaller) majority of Democrats (59%) feel the same way, 33% believe that it is okay to vote against a bill you support to make a point.

Voting on Both Bills — the crosstabs
Dem
16%
17%
18%
41%
Rep
13%
66%
Ind
24%
63%
do anything to get your waycould vote against one they support if unhappy with the otheruse threat to vote against to get your wayuse leverage, but vote consciencevote conscience on both bills
See the details below →

Curious with how this aligns with Americans thoughts on bipartisanship? Check out our previous analysis here.

Conclusion

Although there is always the possibility to misread the motivations of survey participants from the multiple-choice answers given by them, we do believe it is useful to seek the overarching narrative that can be read from a set of related survey questions. We try to formulate one possible narrative in this section.

There is overwhelming bipartisan support for significantly investing in several infrastructure elements. Especially Power Grid Vulnerability (90%), Public Transportation (77%), Roads & Bridges (77%), Disaster Relief (75%), Cybersecurity (70%), and Ports (58%),

There is also majority support for some investment in other categories, such as Electric Vehicles, High-Speed Rail, Lead Pipe replacement, Legacy Pollution Cleanup. For these categories, however, a majority rejects the most far-reaching proposals.

The only outlier is Universal Broadband Access, where only about half of voters believed that a federal government investment is needed.

In almost all cases, even if majorities of all major groups polled (Democrats, Republicans, and Independents) supported an investment, the support among Democrats was the strongest and support among Republicans the weakest.

Ultimately, when it comes to H.R. 3684, a clear majority of Democrats and Independents support it, as well as a significant minority of Republicans, which seems to align with opinions about the individual elements in the bill. It seems that the Senate vote (all 50 Democrats and 19 out of 50 Republicans) are approximately aligned with the sentiments of their constituents.

For SCR14 the situation is very different. Democrats are strongly supportive, Republicans are strongly against, and Independents are evenly divided. This may be related to the fact that there is much less clarity about what is in it and calling it an “infrastructure bill” is by many seen as a liberal usage of the word infrastructure. There has been lots of talk about these two bills and whether they should be linked, which bill should be voted on first, whether progressive Democrats will support the INVEST in America Act, whether any House Republicans will support that same bill, and whether moderate Democrats will support the reconciliation bill. Their constituents are clear about what they want: their representatives should less focus on playing games, and more on voting their conscience.

The Details

Every question in this piece, with its answers as asked, its breakdowns by group and its methodology.

Cyber Security

Should the United States invest more or less in cyber security than we are doing today?

The answers as asked

Charts and tables use the short label at the start of each line.

  1. At least doubled: Cyber warfare spending should be at least doubled.
  2. higher % than other nations: Cyber warfare spending should be set at a greater percentage of GDP than other nations.
  3. fine as is: Cyber warfare spending is fine where it is.
  4. similar to other nations: Cyber warfare spending should be decreased so that spending is similar to other nations.
  5. cut to minimum: Cyber warfare spending should be cut to the minimum possible level.

The full crosstab table

ActiVote · Cyber Security · September 17, 2021
ActiVote 1036 RV At least doubled higher % than other nations fine as is similar to other nations cut to minimum
National ±3.0% MoE 27% 43% 20% 4% 6%
Gender Men 27% 44% 20% 4% 6%
Women 27% 43% 20% 5% 5%
Age 18-29 10% 46% 27% 12% 6%
30-49 33% 44% 12% 4% 6%
50-64 31% 39% 22% 0% 8%
65+ 36% 45% 18% 0% 1%
Ethnicity White 29% 46% 15% 1% 9%
Black 31% 40% 19% 8% 2%
Latino 24% 45% 15% 6% 10%
Education High school 25% 43% 20% 4% 8%
Some college 30% 38% 21% 5% 6%
Bachelor's 25% 50% 18% 4% 2%
Income <50k 30% 41% 22% 1% 6%
50k-100k 26% 44% 14% 8% 8%
>100k 25% 45% 24% 3% 3%
Affiliation Dem 29% 50% 14% 4% 2%
Rep 28% 44% 25% 1% 3%
Ind 28% 39% 20% 7% 5%
Region Dark Red 21% 44% 15% 0% 21%
Light Red 33% 52% 13% 1% 0%
Swing 23% 58% 16% 2% 1%
Light Blue 30% 30% 27% 13% 0%
Dark Blue 28% 32% 26% 5% 9%
Methodology. Fielded September 2021 among 1036 registered voters nationwide. Responses weighted by Demographics and Spectrum. Average expected error ±3.0%. See Why trust our polls? for the methodology, disclosures and accuracy record.

Disaster Relief

Should the federal government provide significant disaster aid to states when they need it, or focus its funding on infrastructure?

The answers as asked

Charts and tables use the short label at the start of each line.

  1. disaster aid as needed: States should be given aid for disasters as they need it.
  2. mostly aid as needed: Some funding should focus on infrastructure improvements, but the majority should be aid for disasters.
  3. split between infrastructure and aid: Disaster aid and infrastructure funding should be split evenly.
  4. mostly infrastructure: Some aid should be given to states with the majority given for infrastructure improvements.
  5. only infastructure: Only funding for infrastructure improvement should be given to states.

The full crosstab table

ActiVote · Disaster Relief · September 17, 2021
ActiVote 431 RV disaster aid as needed mostly aid as needed split between infrastructure and aid mostly infrastructure only infastructure
National ±4.7% MoE 55% 20% 11% 12% 3%
Gender Men 55% 21% 7% 12% 4%
Women 54% 17% 17% 11% 0%
Age 18-29 51% 25% 12% 12% 1%
30-49 48% 17% 13% 17% 5%
50-64 71% 14% 9% 5% 1%
65+ 51% 25% 7% 13% 4%
Ethnicity White 52% 13% 12% 18% 5%
Black 48% 25% 14% 14% 0%
Latino 51% 29% 5% 13% 1%
Education High school 58% 11% 14% 14% 4%
Some college 51% 26% 11% 10% 1%
Bachelor's 57% 19% 8% 13% 3%
Income <50k 48% 22% 10% 20% 1%
50k-100k 64% 11% 15% 5% 5%
>100k 51% 27% 8% 12% 2%
Affiliation Dem 52% 26% 12% 10% 0%
Rep 52% 16% 9% 17% 5%
Ind 50% 24% 15% 11% 0%
Region Dark Red 46% 15% 21% 15% 3%
Light Red 56% 16% 6% 19% 4%
Swing 53% 19% 11% 13% 4%
Light Blue 51% 39% 6% 4% 0%
Dark Blue 64% 14% 12% 9% 1%
Methodology. Fielded September 2021 among 431 registered voters nationwide. Responses weighted by Demographics and Spectrum. Average expected error ±4.7%. See Why trust our polls? for the methodology, disclosures and accuracy record.

Electric Vehicles

Should electric vehicles be encouraged or discouraged, and how strongly?

The answers as asked

Charts and tables use the short label at the start of each line.

  1. mandate all electric ASAP: We should mandate moving to all electric vehicles as soon as possible.
  2. 50% by 2030: We should mandate moving to 50% electric vehicles by 2030.
  3. some incentives: We should provide some incentives for moving to more electric vehicles.
  4. neither encourage nor discourage: We should neither encourage nor discourage electric vehicles.
  5. discourage electric vehicles: Electric vehicles should be discouraged.

The full crosstab table

ActiVote · Electric Vehicles · September 17, 2021
ActiVote 292 RV mandate all electric ASAP 50% by 2030 some incentives neither encourage nor discourage discourage electric vehicles
National ±5.7% MoE 22% 17% 31% 25% 5%
Gender Men 28% 11% 28% 29% 4%
Women 14% 26% 36% 18% 7%
Age 18-29 17% 15% 33% 25% 11%
30-49 29% 18% 28% 19% 6%
50-64 17% 23% 29% 30% 0%
65+ 22% 0% 38% 37% 2%
Ethnicity White 18% 20% 29% 32% 2%
Black 36% 15% 26% 17% 6%
Latino 11% 22% 37% 21% 9%
Education High school 27% 22% 29% 17% 5%
Some college 20% 14% 29% 31% 5%
Bachelor's 20% 16% 35% 23% 7%
Income <50k 19% 20% 35% 21% 4%
50k-100k 22% 14% 24% 36% 4%
>100k 25% 17% 35% 15% 8%
Affiliation Dem 21% 23% 36% 15% 5%
Rep 13% 8% 33% 43% 3%
Ind 13% 30% 39% 13% 5%
Region Dark Red 17% 12% 16% 55% 0%
Light Red 37% 15% 19% 27% 1%
Swing 14% 10% 48% 19% 9%
Light Blue 40% 19% 19% 21% 0%
Dark Blue 16% 25% 33% 17% 9%
Methodology. Fielded September 2021 among 292 registered voters nationwide. Responses weighted by Demographics and Spectrum. Average expected error ±5.7%. See Why trust our polls? for the methodology, disclosures and accuracy record.

High-Speed Rail

Should we do more on high-speed rail than we are doing today?

The answers as asked

Charts and tables use the short label at the start of each line.

  1. should not invest: The United States should not invest at all in high speed rail.
  2. left to the states: The individual states should decide on whether to develop high speed rail lines.
  3. encourage high speed rail: The Federal Government should encourage the development of high speed rail lines.
  4. build between large centers: The Federal Government should focus on building regional high speed rail lines between large population centers.
  5. nation-wide high speed rail: The Federal Government should begin efforts on nation-wide high speed rail lines.

The full crosstab table

ActiVote · High-Speed Rail · September 17, 2021
ActiVote 800 RV should not invest left to the states encourage high speed rail build between large centers nation-wide high speed rail
National ±3.5% MoE 9% 20% 12% 22% 38%
Gender Men 7% 20% 10% 21% 42%
Women 11% 19% 14% 23% 32%
Age 18-29 7% 25% 8% 21% 39%
30-49 12% 16% 6% 21% 45%
50-64 10% 19% 19% 20% 32%
65+ 6% 18% 20% 27% 29%
Ethnicity White 10% 19% 15% 23% 33%
Black 7% 18% 7% 17% 51%
Latino 9% 25% 7% 30% 29%
Education High school 13% 12% 9% 24% 42%
Some college 9% 22% 10% 22% 37%
Bachelor's 4% 25% 16% 19% 35%
Income <50k 9% 19% 16% 24% 32%
50k-100k 14% 24% 11% 11% 41%
>100k 4% 15% 9% 33% 39%
Affiliation Dem 8% 5% 13% 27% 48%
Rep 9% 41% 17% 17% 16%
Ind 6% 15% 11% 25% 43%
Region Dark Red 14% 19% 12% 22% 33%
Light Red 6% 18% 10% 26% 40%
Swing 7% 16% 17% 20% 39%
Light Blue 6% 26% 12% 9% 47%
Dark Blue 11% 21% 7% 29% 32%
Methodology. Fielded September 2021 among 800 registered voters nationwide. Responses weighted by Demographics and Spectrum. Average expected error ±3.5%. See Why trust our polls? for the methodology, disclosures and accuracy record.

Lead Pipes

What role should the federal government play in upgrading lead pipes?

The answers as asked

Charts and tables use the short label at the start of each line.

  1. should play no role: The Federal Government should not play any role in lead pipe upgrades.
  2. only act with clear deterioration: The Federal Government should only act on lead pipe upgrades on public property in cases where the lead pipes have shown significant degradation.
  3. upgrade on public property: The Federal Government should work towards upgrading all lead pipes on public property.
  4. upgrade public and private for those who cannot afford: The Federal Government should upgrade all lead pipes on public property and provide help to homeowners who cannot afford the upgrades themselves.
  5. upgrade all lead pipes: The Federal Government should upgrade all lead pipes on both public and private property.

The full crosstab table

ActiVote · Lead Pipes · September 17, 2021
ActiVote 295 RV should play no role only act with clear deterioration upgrade on public property upgrade public and private for those who cannot afford upgrade all lead pipes
National ±5.7% MoE 9% 13% 13% 37% 28%
Gender Men 9% 9% 15% 35% 33%
Women 8% 20% 10% 42% 19%
Age 18-29 9% 10% 13% 42% 27%
30-49 8% 14% 13% 30% 36%
50-64 4% 18% 17% 42% 18%
65+ 28% 4% 6% 36% 27%
Ethnicity White 7% 10% 13% 42% 28%
Black 11% 12% 12% 37% 28%
Latino 15% 8% 14% 36% 27%
Education High school 4% 9% 13% 43% 31%
Some college 11% 20% 11% 31% 27%
Bachelor's 11% 5% 18% 40% 27%
Income <50k 2% 19% 19% 33% 26%
50k-100k 18% 10% 11% 30% 30%
>100k 7% 10% 10% 45% 28%
Affiliation Dem 6% 10% 7% 46% 30%
Rep 14% 21% 17% 30% 18%
Ind 10% 6% 25% 32% 27%
Region Dark Red 13% 23% 23% 34% 8%
Light Red 1% 18% 16% 30% 35%
Swing 7% 15% 17% 42% 18%
Light Blue 0% 1% 2% 49% 48%
Dark Blue 21% 12% 13% 26% 29%
Methodology. Fielded September 2021 among 295 registered voters nationwide. Responses weighted by Demographics and Spectrum. Average expected error ±5.7%. See Why trust our polls? for the methodology, disclosures and accuracy record.

Legacy Pollution Cleanup

Should the government make funds available to clean up legacy pollution sites?

The answers as asked

Charts and tables use the short label at the start of each line.

  1. no priority at all: Legacy pollution cleanup should not be a priority at all.
  2. proceed, but no priority: Legacy pollution cleanup should proceed in general, but not as a priority.
  3. cleanup, if polluters pay: Legacy pollution cleanup should take place, whenever the original polluters can be made to pay for it.
  4. significant funding in bill: Legacy pollution cleanup should be given significant funding as in the 2021 bipartisan infrastructure bill.
  5. top priority with more funding than in bill: Legacy pollution cleanup should be a top priority receiving more funding than made available in the 2021 bipartisan infrastructure bill.

The full crosstab table

ActiVote · Legacy Pollution Cleanup · September 17, 2021
ActiVote 282 RV no priority at all proceed, but no priority cleanup, if polluters pay significant funding in bill top priority with more funding than in bill
National ±5.8% MoE 2% 17% 26% 36% 20%
Gender Men 3% 20% 27% 26% 23%
Women 0% 11% 24% 52% 13%
Age 18-29 3% 25% 20% 33% 20%
30-49 2% 7% 29% 34% 28%
50-64 0% 16% 31% 39% 13%
65+ 3% 38% 16% 41% 3%
Ethnicity White 1% 15% 27% 41% 16%
Black 0% 10% 14% 35% 41%
Latino 4% 25% 30% 24% 17%
Education ` 4% 18% 29% 29% 20%
Some college 1% 11% 28% 35% 25%
Bachelor's 0% 26% 18% 45% 10%
Income <50k 0% 14% 29% 35% 22%
50k-100k 2% 26% 29% 17% 25%
>100k 2% 9% 20% 57% 12%
Affiliation Dem 0% 13% 19% 52% 16%
Rep 4% 33% 31% 27% 5%
Ind 3% 12% 18% 41% 26%
Region Dark Red 0% 25% 35% 21% 19%
Light Red 0% 20% 36% 15% 29%
Swing 4% 15% 25% 42% 14%
Light Blue 1% 5% 16% 60% 17%
Dark Blue 0% 19% 19% 39% 23%
Methodology. Fielded September 2021 among 282 registered voters nationwide. Responses weighted by Demographics and Spectrum. Average expected error ±5.8%. See Why trust our polls? for the methodology, disclosures and accuracy record.

Ports

Should we provide additional funding for our ports, or should ports become less dependent on the federal government?

The answers as asked

Charts and tables use the short label at the start of each line.

  1. $37 billion: Funding for ports should be increased to $37 billion.
  2. more than the current $22 billion: Ports should receive an increase in funding compared to the $22 billion today.
  3. keep funding as is: Ports should continue being funded as they currently are.
  4. less dependency on federal government: Ports should be encouraged to become less dependent on the Federal Government.
  5. privatize all ports: Ports should all be privatized.

The full crosstab table

ActiVote · Ports · September 17, 2021
ActiVote 718 RV $37 billion more than the current $22 billion keep funding as is less dependency on federal government privatize all ports
National ±3.7% MoE 41% 17% 10% 19% 13%
Gender Men 40% 18% 11% 16% 15%
Women 41% 16% 8% 24% 11%
Age 18-29 46% 12% 10% 17% 15%
30-49 40% 15% 8% 24% 13%
50-64 34% 17% 10% 24% 16%
65+ 44% 33% 16% 3% 3%
Ethnicity White 37% 27% 11% 11% 13%
Black 58% 5% 8% 21% 8%
Latino 33% 20% 10% 22% 15%
Education High school 38% 24% 8% 18% 13%
Some college 47% 13% 12% 17% 11%
Bachelor's 35% 16% 9% 23% 17%
Income <50k 31% 28% 13% 19% 10%
50k-100k 42% 15% 7% 24% 13%
>100k 49% 8% 12% 15% 17%
Affiliation Dem 60% 22% 10% 3% 4%
Rep 19% 24% 18% 27% 12%
Ind 34% 11% 7% 37% 12%
Region Dark Red 38% 9% 11% 23% 19%
Light Red 50% 18% 3% 25% 4%
Swing 30% 28% 9% 12% 19%
Light Blue 51% 22% 6% 17% 4%
Dark Blue 39% 8% 16% 21% 16%
Methodology. Fielded September 2021 among 718 registered voters nationwide. Responses weighted by Demographics and Spectrum. Average expected error ±3.7%. See Why trust our polls? for the methodology, disclosures and accuracy record.

Power Grid Vulnerability

Should we invest in reducing the vulnerability of the power grid?

The answers as asked

Charts and tables use the short label at the start of each line.

  1. invest with highest priority: The vulnerability of our power grid is an existential threat that the US should prioritize and invest with the highest priority.
  2. invest, but not highest priority: The vulnerability of our power grid is a threat and solutions should be invested in accordingly, though not the highest priority.
  3. some limited funding: The vulnerability of our power grid solutions should receive small amounts of funding.
  4. research issue, but no investment just yet: The vulnerability of our power grid should be considered and further researched but not immediately invested in.
  5. is not an issue: Our power grid is not an issue.

The full crosstab table

ActiVote · Power Grid Vulnerability · September 17, 2021
ActiVote 594 RV invest with highest priority invest, but not highest priority some limited funding research issue, but no investment just yet is not an issue
National ±4.0% MoE 53% 37% 1% 6% 3%
Gender Men 54% 36% 0% 6% 4%
Women 50% 40% 2% 6% 2%
Age 18-29 34% 51% 1% 14% 0%
30-49 50% 39% 2% 4% 5%
50-64 62% 30% 0% 2% 6%
65+ 82% 18% 0% 0% 0%
Ethnicity White 56% 36% 1% 4% 3%
Black 57% 40% 0% 3% 0%
Latino 45% 37% 0% 9% 10%
Education High school 57% 37% 0% 1% 5%
Some college 54% 33% 2% 8% 3%
Bachelor's 45% 45% 0% 8% 2%
Income <50k 45% 38% 0% 9% 8%
50k-100k 51% 39% 2% 6% 3%
>100k 61% 35% 0% 3% 0%
Affiliation Dem 56% 37% 2% 5% 0%
Rep 56% 32% 0% 9% 3%
Ind 35% 55% 1% 7% 2%
Region Dark Red 52% 39% 0% 3% 7%
Light Red 50% 41% 1% 5% 3%
Swing 46% 49% 0% 4% 0%
Light Blue 73% 24% 0% 3% 0%
Dark Blue 51% 29% 3% 12% 6%
Methodology. Fielded September 2021 among 594 registered voters nationwide. Responses weighted by Demographics and Spectrum. Average expected error ±4.0%. See Why trust our polls? for the methodology, disclosures and accuracy record.

Public Transportation

How much should be invested in public transportation?

The answers as asked

Charts and tables use the short label at the start of each line.

  1. heavily invest in both rural and urban: We should heavily invest in both rural and urban public transportation.
  2. improve operations and service: We should focus our funding on improving operations and service of public transportation.
  3. left to market: The system should be left as is and the market will determine if investment is appropriate.
  4. decrease subsidies: Subsidies should be decreased and private companies should take over the public rail system.
  5. government should get out of public transport: Government should get out of the business of public transportation entirely.

The full crosstab table

ActiVote · Public Transportation · September 17, 2021
ActiVote 1260 RV heavily invest in both rural and urban improve operations and service left to market decrease subsidies government should get out of public transport
National ±2.8% MoE 56% 21% 8% 7% 8%
Gender Men 54% 21% 9% 6% 10%
Women 59% 21% 7% 7% 6%
Age 18-29 58% 20% 9% 5% 7%
30-49 58% 11% 10% 7% 13%
50-64 52% 24% 9% 5% 11%
65+ 55% 32% 5% 8% 1%
Ethnicity White 43% 26% 11% 13% 8%
Black 63% 13% 12% 1% 11%
Latino 55% 28% 4% 5% 8%
Education High school 56% 21% 15% 4% 4%
Some college 57% 19% 4% 10% 9%
Bachelor's 54% 22% 8% 5% 11%
Income <50k 58% 23% 8% 4% 7%
50k-100k 50% 24% 10% 9% 6%
>100k 62% 15% 6% 6% 12%
Affiliation Dem 75% 21% 1% 2% 0%
Rep 31% 29% 18% 6% 15%
Ind 68% 21% 4% 3% 5%
Region Dark Red 36% 28% 12% 11% 12%
Light Red 65% 14% 14% 3% 5%
Swing 58% 26% 5% 3% 8%
Light Blue 49% 17% 10% 9% 14%
Dark Blue 64% 18% 5% 7% 5%
Methodology. Fielded September 2021 among 1260 registered voters nationwide. Responses weighted by Demographics and Spectrum. Average expected error ±2.8%. See Why trust our polls? for the methodology, disclosures and accuracy record.

Roads & Bridges

Should additional money go to shore up our roads and bridges?

We also asked this question once before:

The answers as asked

Charts and tables use the short label at the start of each line.

  1. major investment, up to standard: We should pass a major surface transportation bill to bring our roads and bridges back up to safety standards.
  2. additional money to make them safe: We should spend additional money on roads & bridges to make them safe, but we should not invest in expansion.
  3. some money now, but then left to states: The federal government should invest more over the next 10 years to bring our roads & bridges up to code, but the states should handle this going forward.
  4. minimum necessary to make them safe: We should spend the minimum necessary making our bridges safe.
  5. no extra money: We should not spend any more money on infrastructure than comes available from the Highway Trust Fund through the current level of taxation.

The full crosstab table

ActiVote · Roads & Bridges · September 17, 2021
ActiVote 1904 RV major investment, up to standard additional money to make them safe some money now, but then left to states minimum necessary to make them safe no extra money
National ±2.2% MoE 66% 11% 14% 1% 7%
Gender Men 63% 10% 16% 1% 10%
Women 70% 12% 13% 2% 4%
Age 18-29 59% 19% 17% 2% 3%
30-49 65% 9% 12% 0% 14%
50-64 69% 7% 19% 0% 5%
65+ 75% 7% 9% 3% 7%
Ethnicity White 61% 7% 20% 2% 9%
Black 75% 9% 10% 0% 6%
Latino 60% 16% 11% 2% 11%
Education High school 66% 9% 11% 1% 12%
Some college 63% 12% 17% 2% 7%
Bachelor's 69% 11% 15% 1% 4%
Income <50k 69% 9% 13% 1% 7%
50k-100k 65% 12% 14% 2% 7%
>100k 65% 11% 16% 1% 8%
Affiliation Dem 80% 7% 9% 0% 3%
Rep 56% 10% 21% 4% 8%
Ind 72% 11% 12% 0% 4%
Region Dark Red 61% 14% 15% 4% 6%
Light Red 78% 7% 12% 0% 2%
Swing 60% 14% 19% 0% 7%
Light Blue 67% 6% 17% 1% 8%
Dark Blue 65% 12% 10% 1% 12%
Methodology. Fielded September 2021 among 1904 registered voters nationwide. Responses weighted by Demographics and Spectrum. Average expected error ±2.2%. See Why trust our polls? for the methodology, disclosures and accuracy record.

Universal Broadband Access

What should the government do about universal broadband access?

We also asked this question once before:

The answers as asked

Charts and tables use the short label at the start of each line.

  1. national internet by government: The government should build a national internet directly to ensure that motives of private companies cannot interfere.
  2. loans and grants from FCC: The FCC should approach this as they did for telephone in the 40s with loans and grants.
  3. local municipalities for their communities: Local municipalities should be allowed to build their own internet service to serve their communities.
  4. internet at libraries and government buildings: The government should focus on providing libraries and government buildings in these areas with service which should be made open to the public.
  5. leave to private business: The government should not interfere with private business which will find innovative ways on its own to solve this problem.

The full crosstab table

ActiVote · Universal Broadband Access · September 17, 2021
ActiVote 11239 RV national internet by government loans and grants from FCC local municipalities for their communities internet at libraries and government buildings leave to private business
National ±0.9% MoE 30% 19% 14% 10% 26%
Gender Men 27% 19% 16% 8% 30%
Women 33% 19% 13% 12% 22%
Age 18-29 27% 19% 18% 10% 26%
30-49 25% 18% 17% 10% 29%
50-64 37% 19% 12% 9% 24%
65+ 32% 22% 8% 12% 26%
Ethnicity White 27% 20% 12% 10% 32%
Black 33% 20% 12% 12% 24%
Latino 33% 20% 11% 8% 28%
Education High school 31% 20% 12% 9% 28%
Some college 33% 19% 14% 10% 23%
Bachelor's 27% 19% 17% 11% 27%
Income <50k 31% 17% 11% 14% 28%
50k-100k 32% 20% 16% 9% 24%
>100k 28% 21% 16% 9% 26%
Affiliation Dem 42% 25% 15% 10% 8%
Rep 24% 15% 14% 10% 37%
Ind 29% 23% 15% 12% 21%
Region Dark Red 28% 16% 11% 13% 31%
Light Red 35% 18% 12% 10% 26%
Swing 28% 21% 9% 12% 29%
Light Blue 27% 21% 18% 10% 24%
Dark Blue 33% 20% 21% 6% 19%
Methodology. Fielded September 2021 among 11239 registered voters nationwide. Responses weighted by Demographics and Spectrum. Average expected error ±0.9%. See Why trust our polls? for the methodology, disclosures and accuracy record.

H.R. 3684

Would you vote for or against H.R. 3684, the "INVEST in America Act"?

The full crosstab table

ActiVote · H.R. 3684 · September 17, 2021
ActiVote 500 RV Yes Unsure No
National ±4.4% MoE 61% 10% 29%
Gender Men 56% 11% 33%
Women 66% 9% 24%
Age 18-29 57% 13% 31%
30-49 70% 10% 20%
50-64 66% 7% 27%
65+ 37% 11% 52%
Ethnicity White 53% 17% 30%
Black 70% 5% 25%
Latino 57% 7% 36%
Education High school 67% 12% 21%
Some college 67% 9% 24%
Bachelor's 47% 10% 44%
Income <50k 73% 8% 19%
50k-100k 51% 12% 37%
>100k 62% 10% 28%
Affiliation Dem 88% 0% 11%
Rep 30% 15% 55%
Ind 69% 15% 16%
Region Dark Red 65% 14% 21%
Light Red 62% 18% 20%
Swing 65% 0% 34%
Light Blue 50% 15% 35%
Dark Blue 58% 9% 32%
Methodology. Fielded September 2021 among 500 registered voters nationwide. Responses weighted by Demographics and Spectrum. Average expected error ±4.4%. See Why trust our polls? for the methodology, disclosures and accuracy record.

SCR 14: “$3.5T Reconciliation Bill”

How should Congress vote on SCR 14, the “$3.5T Reconciliation Bill”?

We also asked this question once before:

The full crosstab table

ActiVote · SCR 14: “$3.5T Reconciliation Bill” · September 17, 2021
ActiVote ActiVote users Yes Unsure No
National 47% 7% 46%
Affiliation Dem 85% 4% 11%
Rep 10% 8% 82%
Ind 44% 16% 41%
Methodology. Fielded August 31 – September 16, 2021 among ActiVote users nationwide. Responses weighted by Demographics and Spectrum. The surviving SCR14 workbook is a later re-run with different values (used by the December 2021 reconciliation review); these values were transcribed from the charts as published in September 2021. The per-poll sample size was not published (the event averaged roughly 1,400 answers per poll). See Why trust our polls? for the methodology, disclosures and accuracy record.

Voting on Both Bills

In how far should representatives vote their conscience when voting on the infrastructure and reconciliation bills?

The answers as asked

Charts and tables use the short label at the start of each line.

  1. do anything to get your way: Representatives should be willing to do anything and everything in order to get their way, no matter the consequences.
  2. could vote against one they support if unhappy with the other: Representatives could actually vote against a bill that they support, if they are unhappy with the other bill.
  3. use threat to vote against to get your way: Representatives can use the threat of voting against their conscience if needed to get the bill of their liking passed.
  4. use leverage, but vote conscience: Representatives should use their leverage to negotiate a reconciliation bill to their liking, but then vote their conscience on each bill.
  5. vote conscience on both bills: Representatives should vote their conscience on both bills, irrespective of the sequence in which they are voted on.

The full crosstab table

ActiVote · Voting on Both Bills · September 17, 2021
ActiVote 261 RV do anything to get your way could vote against one they support if unhappy with the other use threat to vote against to get your way use leverage, but vote conscience vote conscience on both bills
National ±6.1% MoE 13% 10% 6% 16% 56%
Gender Men 17% 10% 7% 12% 54%
Women 5% 10% 4% 21% 59%
Age 18-29 12% 9% 0% 9% 69%
30-49 22% 12% 10% 10% 46%
50-64 4% 8% 5% 29% 54%
65+ 1% 9% 4% 19% 66%
Ethnicity White 6% 8% 4% 22% 60%
Black 27% 14% 12% 10% 37%
Latino 9% 17% 3% 26% 46%
Education High school 18% 7% 4% 13% 57%
Some college 13% 10% 8% 8% 61%
Bachelor's 6% 13% 4% 33% 43%
Income <50k 16% 9% 14% 14% 46%
50k-100k 14% 12% 2% 13% 59%
>100k 9% 8% 3% 20% 60%
Affiliation Dem 16% 17% 8% 18% 41%
Rep 9% 6% 7% 13% 66%
Ind 0% 8% 5% 24% 63%
Region Dark Red 8% 13% 8% 19% 53%
Light Red 30% 0% 8% 7% 56%
Swing 11% 14% 9% 18% 48%
Light Blue 3% 5% 1% 15% 77%
Dark Blue 10% 13% 3% 18% 56%
Methodology. Fielded September 2021 among 261 registered voters nationwide. Responses weighted by Demographics and Spectrum. Average expected error ±6.1%. See Why trust our polls? for the methodology, disclosures and accuracy record.