Half of America Strongly Rejects the Democratic Socialists’ Program
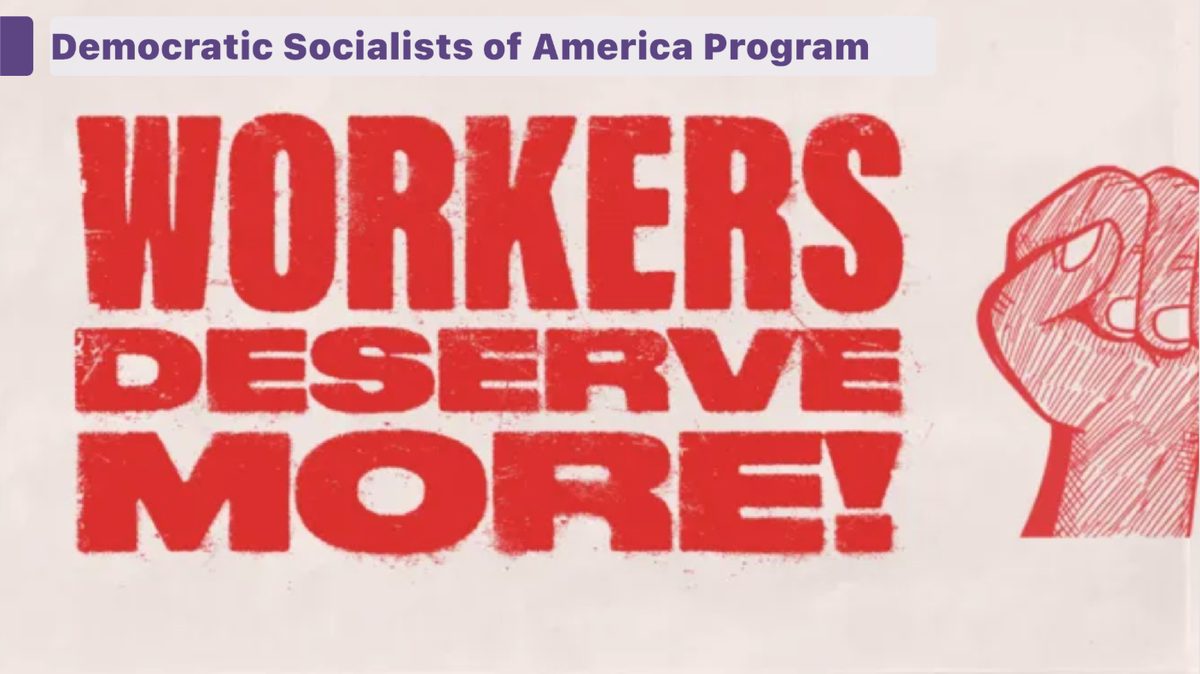
The Democratic Socialists of America is a political nonprofit that organizes activists, endorses candidates and writes policy platforms. On July 4, 2026, it reported 120,000 dues-paying members, passing the Socialist Party of America’s peak of roughly 113,000 members in 1912.
On July 14, 2026, under a mandate from its 2025 National Convention, the organization launched a program called “Workers Deserve More.” On the structure of government, it calls for abolishing the Senate and the Electoral College, replacing the presidency and the Supreme Court with an executive and a judiciary selected by and subordinate to Congress, expanding the House of Representatives, and adopting proportional representation and ranked choice voting.
On the economy it calls for public ownership of large corporations and essential industries, a 32-hour workweek at full pay and benefits, universal paid family leave, universal healthcare, universal affordable housing with rent control, cancellation of student debt and a federal jobs guarantee. It also calls for higher taxes on wealthy people and corporations, redirecting police funding as steps towards fully abolishing the police and prison system, an end to immigration detention and deportation, and expanded immigrant rights.
Candidates who seek the organization’s national endorsement must commit to uphold and promote the program and to align their campaigns with it as far as possible. The program proposes organizing and building an independent working-class party, and calls for drafting a new constitution, but does not specify the legal process by which the existing institutions would be replaced.
We wondered what Americans think about the Democratic Socialists of America 2026 Program. So, we asked 764 registered voters (MoE of 3.5%) from August 17 to August 23, 2026 about it:
Which of the following statements best reflects your opinion on the Democratic Socialists of America 2026 Program?
- Strongly approve
- Approve
- Neutral
- Disapprove
- Strongly disapprove
What voters said
Half the country, 50.7%, strongly disapproves of the program. Adding the 7.0% who disapprove without the intensifier brings total disapproval to 57.7%. On the other side, 22.3% strongly approve and 11.3% approve, for total approval of 33.6%. Another 7.8% are neutral and 0.9% chose none of the above.
What stands out is not only the margin, but where the answers sit. The two strongest options together account for 73% of all responses, while only about one quarter selected one of the three middle responses. Among those who approve, two out of three do so strongly; among those who disapprove, seven out of eight do.
Across the political spectrum
On the Left the program is close to consensus: 69% strongly approve and another 24% approve, for 93% approval, with 1% strongly disapproving. The Moderate Left is more measured but still positive, at 32% strongly approving and 25% approving, for 57% approval, with 19% neutral and 22% disapproving in total.
In the Center approval drops to 18% while 54% strongly disapprove, taking total disapproval to 69%. On the Moderate Right few chose either approving answer, and 91% strongly disapprove. On the Right the figures are 0% approval and 97% strong disapproval.
The Center is the finding that matters most here. On many issues it behaves like a midpoint between the two sides. On this one it does not: at 69% disapproval it sits far closer to the Moderate Right than to the Moderate Left. The program’s support does not extend past the two quintiles on the left side of the spectrum.
By party
Party registration tells the same story. Among registered Republicans, 93% strongly disapprove and a further 5% disapprove, for 98% opposition, with 1% choosing either approving answer.
Registered Democrats approve, but with noticeably less unanimity than Republicans oppose: 46% strongly approve and 21% approve, for 67% approval, while 22% of Democrats disapprove and 9% are neutral. Roughly one Democrat in five rejects the program that DSA asks candidates seeking its national endorsement to commit to.
Independents break clearly against it, 59% to 26%, with 14% neutral, the largest neutral share of any party group.
Across the generations
Age produces a large and unusually consistent progression.
Voters aged 18 to 29 are the only age group where the program is net positive: 34% strongly approve and 16% approve, for 50% approval, against 42% disapproval. From there support falls at every step. Among 30- to 49-year-olds it is 37% approval to 56% disapproval. Among 50- to 64-year-olds, 31% to 60%. Among those 65 and older, 23% to 68%.
Strong disapproval nearly doubles across the same span, from 34% among the youngest voters to 62% among the oldest. A program that the national majority rejects by 24 points is one the youngest cohort accepts by 8.
Two Visions of America
The numbers reveal two different visions of America.
The first believes that political institutions, economic ownership, taxation, public safety and immigration enforcement should be radically transformed so that power and resources are distributed more equally. In this view the Senate, the Electoral College and an independent judiciary are obstacles to achieving that vision, and private ownership of essential industries is the source of the inequality that politicians keep failing to fix.
The second believes that existing representative institutions, private ownership, established public-safety systems and enforced immigration rules are essential features of American society and must be protected. In this view the checks the program would remove are precisely what stops a temporary majority from remaking the country.
These are not two visions close to each other with a logical compromise in the middle, and the responses show it: the two strongest options account for 73% between them. The country is expressing which type of America they want to live in. Voters who answered this question were being asked about the architecture of the republic, which may be why so few of them answered mildly.
Crosstabs
Zooming out
In our previous national poll, we asked Americans about New York City’s plan for five city-owned grocery stores, a single proposal in the same broad family of public ownership. There, 55% were willing to proceed with some version of the program and 43% wanted it stopped. In back-to-back weeks, national samples leaned toward trying municipal groceries and rejected the DSA program by 24 points.
The difference suggests that the opposition is not to having any public programs at all. A discounted grocery store is a service a city can try and abandon. Replacing the Senate, the courts and private ownership of major industries seem, for the majority, a bridge too far.
Voters under 30, however, approve of the program on balance. Whether that reflects a stage of life or the beginning of a durable shift in the country’s position on socialism is the question worth watching.
See more of what America thinks in our ongoing polls.
Want to be included in our next poll? Check out the app!
 | 764 RV | Unweighted | Weighted | Strongly approve | Approve | Neutral | Disapprove | Strongly disapprove | None of the above |
|---|---|---|---|---|---|---|---|---|---|
| National | ±3.5% MoE | 100% | 100% | 22% | 11% | 8% | 7% | 51% | 1% |
| Political Spectrum | Left | 33% | 20% | 69% | 24% | 5% | 1% | 1% | 0% |
| Moderate Left | 28% | 20% | 32% | 25% | 19% | 12% | 10% | 2% | |
| Center | 15% | 20% | 11% | 7% | 12% | 15% | 54% | 1% | |
| Moderate Right | 11% | 20% | 0% | 0% | 3% | 5% | 91% | 0% | |
| Right | 13% | 20% | 0% | 0% | 0% | 2% | 97% | 1% | |
| Region | rural | 38% | 34% | 17% | 8% | 9% | 8% | 56% | 1% |
| suburban | 33% | 30% | 20% | 11% | 8% | 7% | 54% | 0% | |
| urban | 30% | 35% | 29% | 14% | 6% | 6% | 43% | 1% | |
| Age | 18-29 | 31% | 16% | 34% | 16% | 8% | 8% | 34% | 0% |
| 30-49 | 37% | 32% | 25% | 12% | 7% | 8% | 48% | 0% | |
| 50-64 | 18% | 23% | 21% | 10% | 8% | 7% | 53% | 1% | |
| 65+ | 14% | 28% | 14% | 9% | 8% | 6% | 62% | 2% | |
| Gender | F | 29% | 53% | 28% | 13% | 9% | 5% | 44% | 1% |
| M | 71% | 47% | 16% | 9% | 6% | 10% | 59% | 0% | |
| Affiliation | D | 45% | 36% | 46% | 21% | 9% | 8% | 14% | 1% |
| R | 25% | 31% | 1% | 0% | 1% | 5% | 93% | 1% | |
| I | 27% | 30% | 15% | 11% | 14% | 8% | 51% | 1% | |
| Ethnicity | White | 84% | 66% | 19% | 10% | 6% | 8% | 56% | 1% |
| Black | 8% | 11% | 35% | 20% | 12% | 5% | 24% | 3% | |
| Latino | 5% | 15% | 29% | 10% | 8% | 5% | 47% | 0% | |
| Income | Low | 24% | 25% | 29% | 12% | 10% | 4% | 46% | 0% |
| Middle | 30% | 30% | 23% | 9% | 8% | 8% | 51% | 1% | |
| High | 45% | 44% | 18% | 12% | 6% | 8% | 53% | 2% | |
| Education | Highschool | 19% | 26% | 22% | 9% | 10% | 3% | 55% | 0% |
| Some College | 68% | 60% | 25% | 11% | 6% | 8% | 49% | 1% | |
| BSC+ | 13% | 14% | 12% | 16% | 10% | 8% | 51% | 1% |