Do we like rules and regulations?
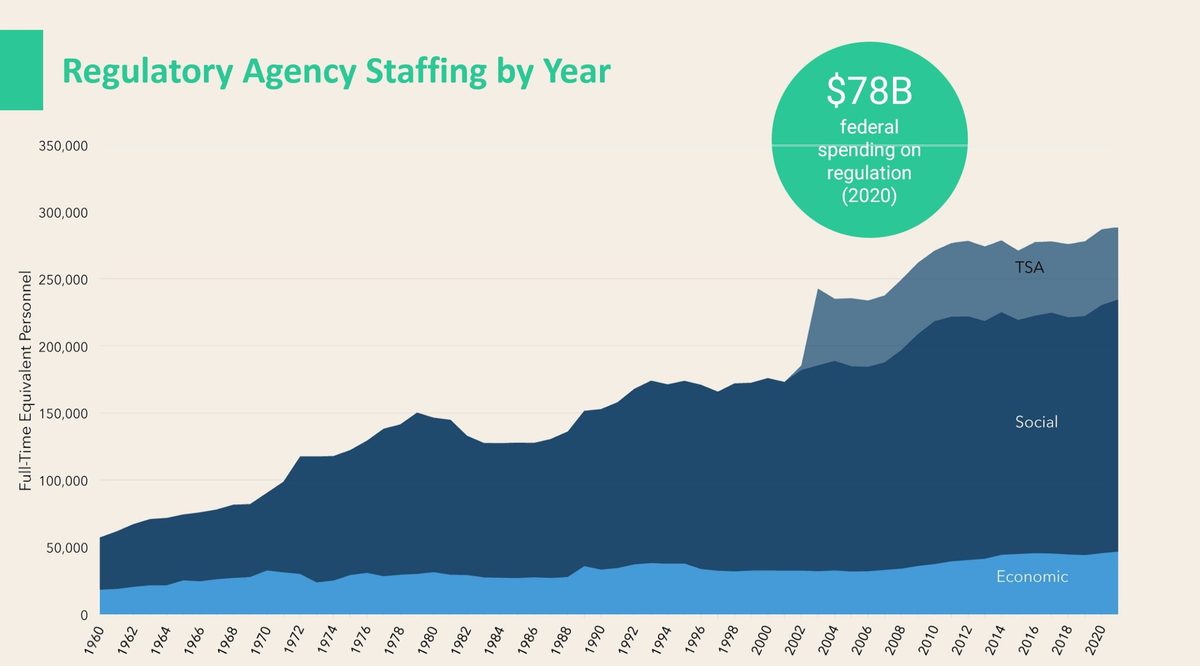
Government regulation became a major topic of discussion during the 2024 election when Elon Musk and the Trump campaign pitched the Department of Government Efficiency (DOGE). After the election, President-elect Trump announced that a presidential advisory commission would be created, called DOGE, led by Elon Musk and Vivek Ramaswamy, aiming to significantly cut the size and cost of the federal government.
While opinions about DOGE specifically, can be expected to be viewed through a partisan lens, ActiVote wondered what voters think about government regulation in general: do we have too much regulation, or too little? As we have been asking this question in the ActiVote app for the past few years, we analyzed what people’s opinions are in 2024.
In total 2845 people participated in our poll between January 1, 2024 and December 11, 2024. We asked them the following question.
Which of these statements best reflects your opinion on government regulation?
- Regulations (both social and economic) should be minimized as much as possible.
- We are somewhat over-regulated at this time, in both economic and social areas, and we should cut more regulations than we should add.
- The current amount of regulations is approximately right.
- We are somewhat under-regulated at this time, in both economic and social areas, and we should add more regulations than we should cut.
- We are underregulated both socially and economically.
In the following graphs and tables these answers have been abbreviated to:
- Minimize regulations
- Cut more regulations than add
- Current situation is about right
- We should add more regulations than we should cut
- We are underregulated
Poll Results
A majority (53%) of people believe we should minimize regulations altogether, while another 17% believe that we should cut more regulations than we should add. On the other end of the spectrum 24% believe that we need to expand on the number of regulations that we have. Thus, there is a clear 70%-24% majority for deregulation.
Party Affiliation
In all parties there is a preference for deregulation over more regulation. Republicans are near unanimous with 91%-6% for deregulation. Independents support deregulation by 66%-26%, while Democrats support deregulation by 54%-38%.
Political Spectrum
There is a clear split between the 20% of voters on the left, compared to the moderate left, center, moderate right and right: the left in large majority 81%-11% believes we need more regulation. In all other groups, there is majority support for less regulation. The moderate left support deregulation by 51%-34%, while the center (85%-9%), moderate right (97%-2%) and right (100%-0%) are near unanimous that we need less regulation.
Crosstabs
The following table shows for every subcategory of voters what the unweighted participation in our poll was, as well as the participation after weighting to correctly reflect the national electorate, followed by the weighted poll answers for the voters in that category.
From the table it can be seen that before weighting there was overrepresentation of rural voters, younger voters (18-64), male voters, Democrats and Republicans, White voters, high income voters, those having a college education and moderate left, center and moderate right voters.
After weighting, the poll correctly represented the national electorate.
Omitted from the table are those subcategories for which the national electorate or our unweighted sample (or both) does not reach the threshold of 5%. For this poll that applies to those registered with a 3rd party, Asians and those with ethnicity “Other”. Their (weighted) votes are included in the overall result.
After weighting, the poll correctly represented the national electorate.
Methodology
Check out our polling page for our latest election polls, and Why trust our polls? for our methodology, disclosures and accuracy record.
 | 2845 RV | Unweighted | Weighted | Minimize regulations | Cut more regulations than add | Current situation is about right | We should add more regulations than we should cut | We are underregulated |
|---|---|---|---|---|---|---|---|---|
| National | ±1.8% MoE | 100% | 100% | 53% | 17% | 6% | 16% | 8% |
| Political Spectrum | Left | 15% | 20% | 7% | 4% | 7% | 47% | 34% |
| Moderate Left | 24% | 20% | 34% | 17% | 15% | 28% | 6% | |
| Center | 27% | 20% | 61% | 24% | 7% | 7% | 2% | |
| Moderate Right | 21% | 20% | 76% | 21% | 1% | 1% | 1% | |
| Right | 13% | 20% | 83% | 17% | 1% | 0% | 0% | |
| Region | rural | 38% | 32% | 57% | 19% | 5% | 13% | 7% |
| suburban | 34% | 36% | 57% | 15% | 5% | 15% | 8% | |
| urban | 28% | 32% | 46% | 16% | 8% | 20% | 10% | |
| Age | 18-29 | 16% | 15% | 46% | 14% | 4% | 21% | 15% |
| 30-49 | 41% | 32% | 53% | 13% | 5% | 19% | 11% | |
| 50-64 | 28% | 25% | 55% | 17% | 7% | 13% | 8% | |
| 65+ | 15% | 28% | 55% | 22% | 7% | 12% | 3% | |
| Gender | F | 28% | 52% | 53% | 14% | 7% | 17% | 9% |
| M | 72% | 48% | 54% | 20% | 4% | 15% | 8% | |
| Affiliation | D | 42% | 38% | 39% | 15% | 8% | 26% | 12% |
| R | 42% | 33% | 72% | 19% | 3% | 4% | 2% | |
| I | 13% | 27% | 49% | 17% | 7% | 16% | 10% | |
| Ethnicity | White | 81% | 68% | 55% | 19% | 5% | 13% | 8% |
| Black | 8% | 11% | 49% | 8% | 9% | 24% | 10% | |
| Latino | 8% | 14% | 50% | 12% | 6% | 20% | 12% | |
| Income | Low | 15% | 20% | 54% | 13% | 6% | 20% | 7% |
| Middle | 34% | 43% | 54% | 18% | 5% | 13% | 10% | |
| High | 50% | 38% | 53% | 17% | 7% | 17% | 7% | |
| Education | Highschool | 22% | 33% | 56% | 16% | 5% | 13% | 9% |
| Some College | 11% | 22% | 47% | 19% | 5% | 21% | 9% | |
| BSC+ | 67% | 45% | 55% | 16% | 7% | 15% | 7% |