Department of Government Efficiency
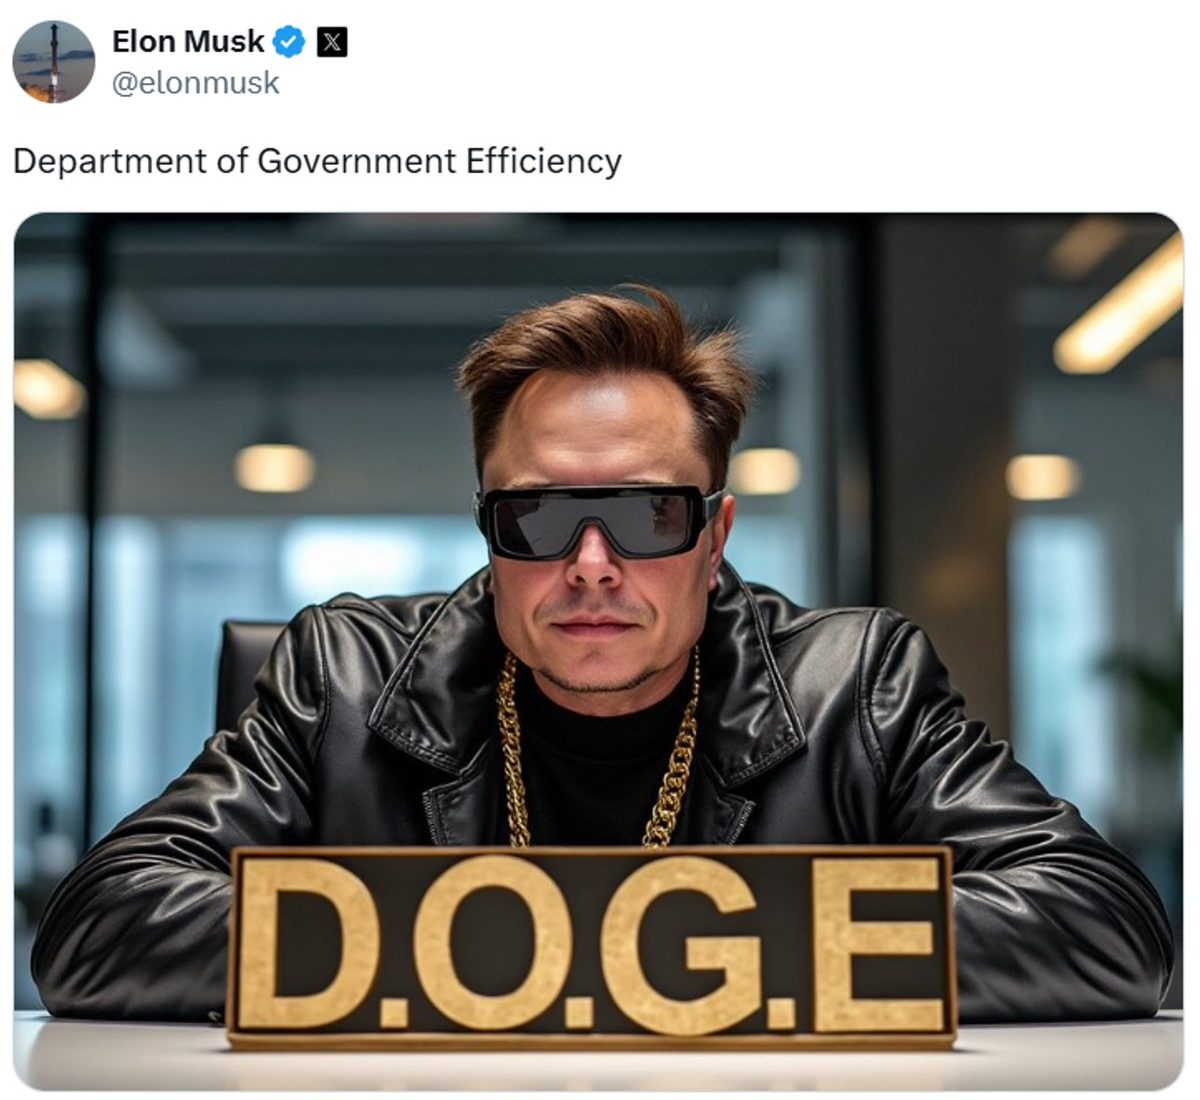
On September 7, 2024, two months before the US Presidential Election, Elon Musk posted on X a meme, ultimately viewed by hundreds of millions of people, that suggested that he might take a role in a newly to be created Department of Government Efficiency (D.O.G.E), if Trump won a second term. On November 12, 2024, one week after the election, president-elect Trump announced that he would create a presidential advisory commission under this name which would be led by Elon Musk and Vivek Ramaswamy.
In relation to D.O.G.E, Musk and Ramaswamy have made various suggestions of what they might do, including reducing the number of federal agencies from about 400 to about 100, reducing the federal workforce by 75%, forcing federal workers to work from their offices instead of from home, reducing regulations and more.
While much is still unclear about what D.O.G.E will do in practice, we wondered what the American people think about this initiative. Therefore, between November 22, 2024 and December 11, 2024 ActiVote has conducted a survey in the ActiVote app to determine what the American people think about D.O.G.E. The 997 people who weighed in answered the following question:
Which of these statements best reflects your opinion on the Department of Government Efficiency?
- The initiative should not exist.
- The initiative should only focus on changes to regulation.
- The initiative should focus on regulation as well as expensive processes and procedures.
- The initiative should focus on everything, including personnel costs.
- This should become an official department with a mandate and power to enact change.
In the following graphs and tables these answers have been abbreviated to:
- Cancel it.
- Regulation focused.
- Regulation plus process and procedure.
- Focus on everything.
- Official department with power
Poll Results
The two most common answers are the extremes: cancel the initiative altogether (38%) and create a full-fledged official department with power (32%). The next most popular answer, focus on everything has support from 20% of the population, suggesting that a majority of 52% supports D.O.G.E either as advisory commission or as a department, significantly outpacing the minority of 38% who sees nothing in the initiative. The final 10% of voters believes that some focus on regulations and/or process and procedure is fine.
Party Affiliation
As can be expected from the fact that D.O.G.E is a proposal of an incoming Republican administration, there is far more support among Republicans than among Democrats. Republicans support D.O.G.E by 80%-11%, while Democrats oppose D.O.G.E. by 60%-30%. Independents support the initiative by 50%-39%.
Political Spectrum
The 20% of voters on the left completely reject D.O.G.E: 91% are against while only 3% support it. The moderate left also in large majority rejects the idea: 67% vs. 19%. Those on the right fully support the idea: 91% vs. 4% as do those on the moderate right: 85% vs. 6%.
Those in the center are more for than against: 56% support D.O.G.E.while 29% oppose it.
Crosstabs
The following table shows for every subcategory of voters what the unweighted participation in our poll was, as well as the participation after weighting to correctly reflect the national electorate, followed by the weighted poll answers for the voters in that category.
From the table it can be seen that before weighting there was overrepresentation of rural and suburban voters, younger voters (18-49), male voters, Democrats and Republicans, White voters, high income voters, those having a college education and left and moderate left voters.
After weighting, the poll correctly represented the national electorate.
Omitted from the table are those subcategories for which the national electorate orour unweighted sample (or both) does not reach the threshold of 5%. For this poll that applies to those registered with a 3rd party, Asians and those with ethnicity “Other”. Their (weighted) votes are included in the overall result.
Methodology
Check out our polling page for our latest election polls, and Why trust our polls? for our methodology, disclosures and accuracy record.
 | 997 RV | Unweighted | Weighted | Cancel it. | Regulation focused. | Regulation plus process and procedure. | Focus on everything. | Official department with power |
|---|---|---|---|---|---|---|---|---|
| National | ±3.1% MoE | 100% | 100% | 38% | 1% | 9% | 20% | 32% |
| Political Spectrum | Left | 23% | 20% | 91% | 1% | 5% | 1% | 2% |
| Moderate Left | 29% | 20% | 67% | 3% | 12% | 9% | 10% | |
| Center | 19% | 20% | 27% | 2% | 16% | 22% | 34% | |
| Moderate Right | 15% | 20% | 6% | 0% | 8% | 34% | 51% | |
| Right | 14% | 20% | 4% | 0% | 5% | 31% | 60% | |
| Region | rural | 34% | 32% | 32% | 1% | 10% | 24% | 33% |
| suburban | 38% | 36% | 33% | 1% | 13% | 22% | 32% | |
| urban | 27% | 32% | 50% | 1% | 4% | 13% | 32% | |
| Age | 18-29 | 30% | 15% | 41% | 4% | 11% | 16% | 28% |
| 30-49 | 41% | 32% | 40% | 1% | 8% | 16% | 35% | |
| 50-64 | 21% | 25% | 33% | 0% | 11% | 20% | 36% | |
| 65+ | 9% | 28% | 39% | 0% | 8% | 26% | 28% | |
| Gender | F | 21% | 52% | 43% | 1% | 8% | 18% | 30% |
| M | 79% | 48% | 33% | 2% | 10% | 21% | 35% | |
| Affiliation | D | 40% | 39% | 60% | 1% | 9% | 10% | 20% |
| R | 36% | 33% | 11% | 0% | 9% | 31% | 49% | |
| I | 21% | 27% | 39% | 1% | 10% | 20% | 30% | |
| Ethnicity | White | 81% | 68% | 35% | 1% | 9% | 23% | 32% |
| Black | 7% | 11% | 53% | 1% | 16% | 6% | 23% | |
| Latino | 7% | 14% | 57% | 1% | 5% | 8% | 30% | |
| Income | Low | 20% | 20% | 44% | 2% | 12% | 11% | 31% |
| Middle | 35% | 42% | 38% | 1% | 7% | 20% | 34% | |
| High | 45% | 37% | 35% | 1% | 11% | 24% | 30% | |
| Education | Highschool | 27% | 33% | 43% | 3% | 11% | 4% | 39% |
| Some College | 10% | 23% | 30% | 0% | 9% | 29% | 31% | |
| BSC+ | 63% | 44% | 38% | 0% | 8% | 26% | 28% |