
ActiVote
← All analysis
February 1, 2021

Deferred Action for Childhood Arrivals
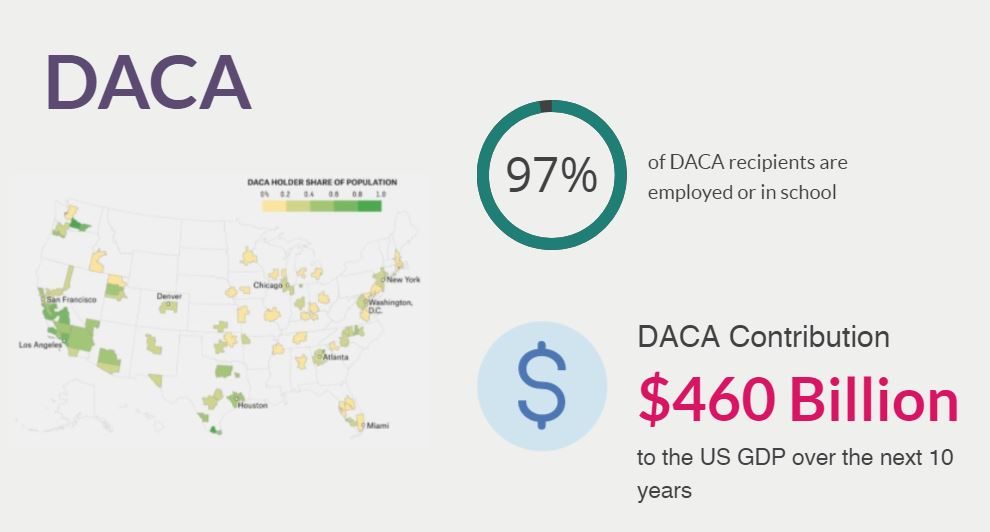
The “DACA” executive order signed by President Obama in 2014 has always been controversial, as it was a response to the inability of Congress to pass immigration reform. In 2017 President Trump rescinded DACA which was subsequently challenged in court and in June 2020 the Supreme Court ruled against the Trump Administration. As one of his first actions after his inauguration, President Biden reinstated DACA.

This partisan back-and-forth begs the question of what the American people think about DACA and whether they are as split along party lines as the executive actions suggest. To find that out, ActiVote conducted a survey to determine what our users think about DACA.

We provided five options to choose from, which can be summarized as follows:

  • All 1.7M should be given a pathway to citizenship
  • DACA should be kept in place until Congress acts
  • The courts should decide
  • DACA should be rescinded
  • All 1.7M should leave the US
The headline result
All 1.7M given pathway to citizenship
54%
DACA kept in place until Congress acts
23%
Let courts decide
7%
DACA should be rescinded
10%
All 1.7M should leave the US
7%
See the details below →

Just over half of Americans think that Dreamers should be given a pathway to citizenship. Another quarter believes that DACA should be kept in place, allowing them to stay, until Congress passes immigration reform. In other words: 3 in 4 Americans believe that Dreamers should stay in the US no matter what. Only 17% believes that DACA should be rescinded and/or Dreamers should leave the US.

The crosstabs
<50k
58%
16%
11%
11%
50k-100k
55%
22%
>100k
48%
29%
11%
All 1.7M given pathway to citizenshipDACA kept in place until Congress actsLet courts decideDACA should be rescindedAll 1.7M should leave the US
See the details below →

There are some small differences in opinion based on income. Interestingly, those earning lower incomes, are both more likely (58% vs. 54% overall) to support a full pathway to citizenship and to oppose DACA (22% vs 17% overall).

The crosstabs
Dem
68%
21%
Rep
25%
26%
15%
17%
17%
Ind
63%
19%
All 1.7M given pathway to citizenshipDACA kept in place until Congress actsLet courts decideDACA should be rescindedAll 1.7M should leave the US
See the details below →

There is a clear partisan divide in that almost 90% of Democrats and over 80% of independents support DACA and/or a pathway to citizenship, which is significantly higher than the 51% of Republicans who do the same. At the same time, even among Republicans only 1 in 3 believe that DACA should be rescinded and/or Dreamers should leave the US.

With that, ultimately, the status of the last 6 years of Dreamers being allowed to stay in the US seems to be the will of the people. Perhaps it is time for the 117th Congress to enact that into law.

The Details

We also asked this question once before:

The answers as asked

Charts and tables use the short label at the start of each line.

  1. All 1.7M given pathway to citizenship: All 1.7 Million ΓÇ£DREAMersΓÇ¥ should be given permanent legal status and a pathway to Citizenship.
  2. DACA kept in place until Congress acts: DACA should be kept in place for its approximately 800,000 current recipients (but not allowing new sign-ups) until Congress passes comprehensive immigration reform.
  3. Let courts decide: The courts should decide whether or not DACA is constitutional.
  4. DACA should be rescinded: DACA should be rescinded as no President should be allowed to write immigration law without Congress.
  5. All 1.7M should leave the US: All 1.7 Million ΓÇ£DREAMersΓÇ¥ are here illegally and should return to their country of citizenship.

The full crosstab table

ActiVote · DACA · February 1, 2021
ActiVote 2490 RV All 1.7M given pathway to citizenship DACA kept in place until Congress acts Let courts decide DACA should be rescinded All 1.7M should leave the US
National ±2.0% MoE 54% 23% 7% 10% 7%
Gender Men 53% 19% 7% 13% 7%
Women 54% 27% 7% 7% 6%
Age 18-29 53% 24% 10% 7% 6%
30-49 58% 20% 8% 9% 5%
50-64 54% 24% 3% 10% 8%
65+ 46% 22% 7% 16% 9%
Ethnicity White 48% 24% 7% 13% 8%
Black 68% 14% 4% 13% 1%
Latino 52% 23% 10% 8% 7%
Education High school 56% 16% 6% 12% 10%
Some college 57% 26% 5% 8% 5%
Bachelor's 48% 26% 11% 11% 5%
Income <50k 58% 16% 4% 11% 11%
50k-100k 55% 22% 8% 8% 6%
>100k 48% 29% 8% 11% 4%
Affiliation Dem 68% 21% 2% 8% 1%
Rep 25% 26% 15% 17% 17%
Ind 63% 19% 5% 8% 5%
Region Dark Red 46% 26% 7% 13% 8%
Light Red 57% 19% 7% 12% 5%
Swing 61% 21% 2% 10% 6%
Light Blue 50% 20% 12% 9% 8%
Dark Blue 51% 26% 7% 7% 7%
Methodology. Fielded February 2021 among 2490 registered voters nationwide. Responses weighted by Demographics and Spectrum. Average expected error ±2.0%. See Why trust our polls? for the methodology, disclosures and accuracy record.