
Virginia abolishes the death penalty - what does America think?
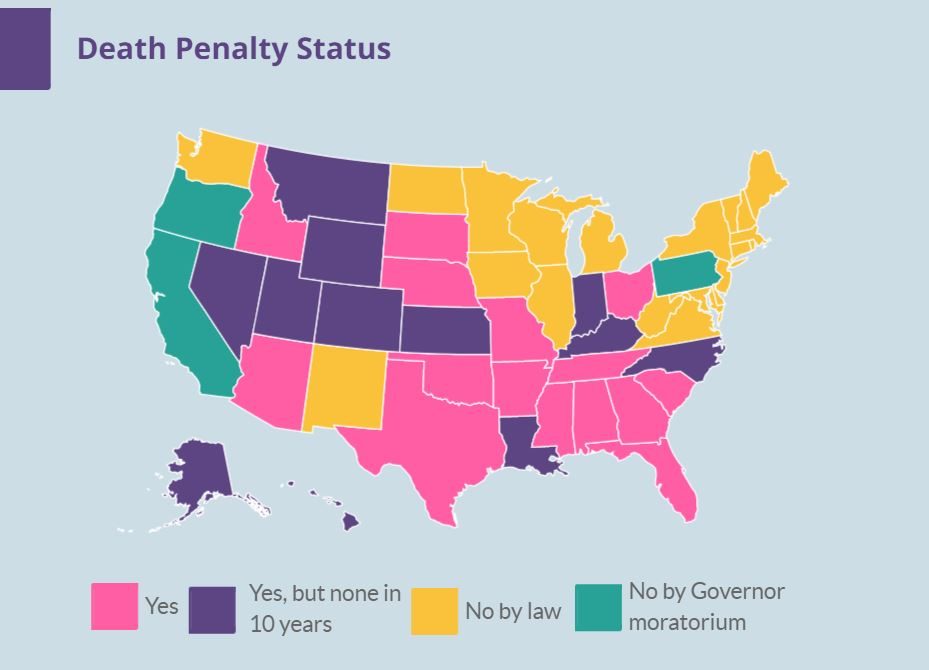
On March 24th, 2021, Virginia abolished the death penalty. While it joins almost half of states (23 in total now), this is particularly significant for the role Virginia has played in the history of the death penalty.
The first execution in the United States took place in Virginia in 1608. The largest number of executions in any state since 1608 (over 1300) took place in Virginia. And since the 1976 Supreme Court decision that the death penalty is constitutional, Virginia has executed more people than any other state except Texas. So, when Virginia, the first Southern state to do so, abolishes the death penalty, it is a momentous occasion for those opposed to the death penalty.
The question we asked is what the American people think about the death penalty. As we found out, if you ask a nuanced question: it is complicated. We asked almost 4,000 participants to pick from the following five options:
- The death penalty should be abolished in all states.
- The death penalty should be banned except in cases with undeniable evidence for the most heinous crimes, such as war crimes and terrorism.
- The death penalty should be allowed, however increased standards of proof should be applied before it can be applied.
- The death penalty is an important tool to fight crime and should be allowed in all states.
- The death penalty should be expanded and used more often to deter heinous crimes.
Nationally, among all our users, a minority of 37% believe that it should be abolished outright but a majority of 58% wants to abolish it for anything except war crimes and terrorism. Still, 1 in 3 Americans believes it should be allowed in all states or used more often.
If we combine the two answers that favor restricting it vs. the two answers that want to keep it or expand it then older individuals (50+) are more supportive of the death penalty than younger individuals (18-49 yrs) by about 20%,
Although there is a difference of opinion based on party affiliation, the differences are relatively small: Democrats are less supportive of the death penalty, but still 27% supports it or wants it expanded, compared to 40% for Republicans. On the other hand, 69% of Democrats want to see it abolished, or only allow it for terrorism and war crimes, while only 43% of Republicans think that way.
While opinions differ over the death penalty with no clear majority either for or against, the trend of fewer executions and slowly increasing number of states that abolish the measure seems in line with the fact that it is deemed less acceptable by the younger generations.