
Corporate Tax Rate
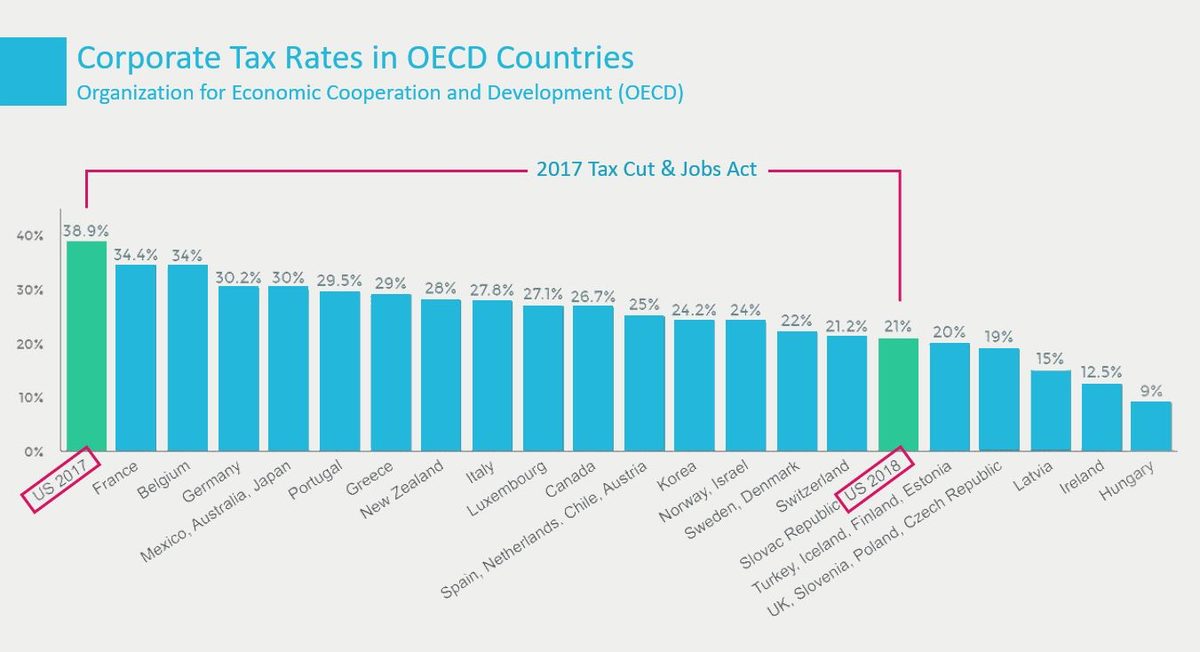
As part of President Biden’s American Job’s Plan, which is an over $2 trillion investment in infrastructure and more, he also launched the “Made in America Tax Plan”. That plan focuses on the taxes paid by large corporations and specifically proposes to raise the corporate tax rate up to 28%. The corporate tax rate had been 35% since 1994 until it was reduced to 21% by the Tax Cut and Jobs Act enacted in 2017 under the Trump Administration.
Biden did receive some immediate pushback on the 28% number and others have suggested 24% or 25% as an alternative instead. In any case: it is likely that something will happen with the corporate tax rate in the coming months so we asked our users what they think and gave them 5 options to choose from:
- 15% (capital gains rate under Bush Jr)
- 21% (current rate enacted by Trump)
- 21%, but with an increase in capital gains taxes (tax gains of shareholders)
- 24% (average tax rate of OECD countries)
- 35% (previous corporate tax under Clinton, Bush & Obama)
2,630 of our users weighed in. It turns out that a clear majority of 3 in 4 people feel that we should increase taxes on corporations. Only 1 in 6 believe that we should decrease corporate taxes below its current level.
We wondered whether the popularity of “Taxing The Rich”, which is how taxing large corporations at higher rates is often perceived, would be more popular with those earning lower incomes. There is some truth to that, with 43% of those earning middle incomes supporting a return to the Clinton-Bush-Obama corporate tax rate. However, overall support for higher taxes on corporations is strong among all groups: even higher incomes support some form of increase by a large majority of 70%.
The main predictor for support for a corporate tax increase is party affiliation. A majority of Democrats want to go back to the pre-Trump rates, and another 33% want some sort of increase. Republicans, on the other hand, are 50/50 split: half would like to stick with the Trump rate of 21% or lower it even further. The other half wants to see at least some sort of increase.
With strong support among the American people for some sort of increase of taxes that are paid by large corporations (or their shareholders), it is likely that the corporate tax rate in 2022 will not stay at the 21% that is at today. It seems that an outcome between the 24% average of all OECD countries and the Biden proposal of 28% seems to be the most logical outcome that would have majority support in the country.