
Civics Education
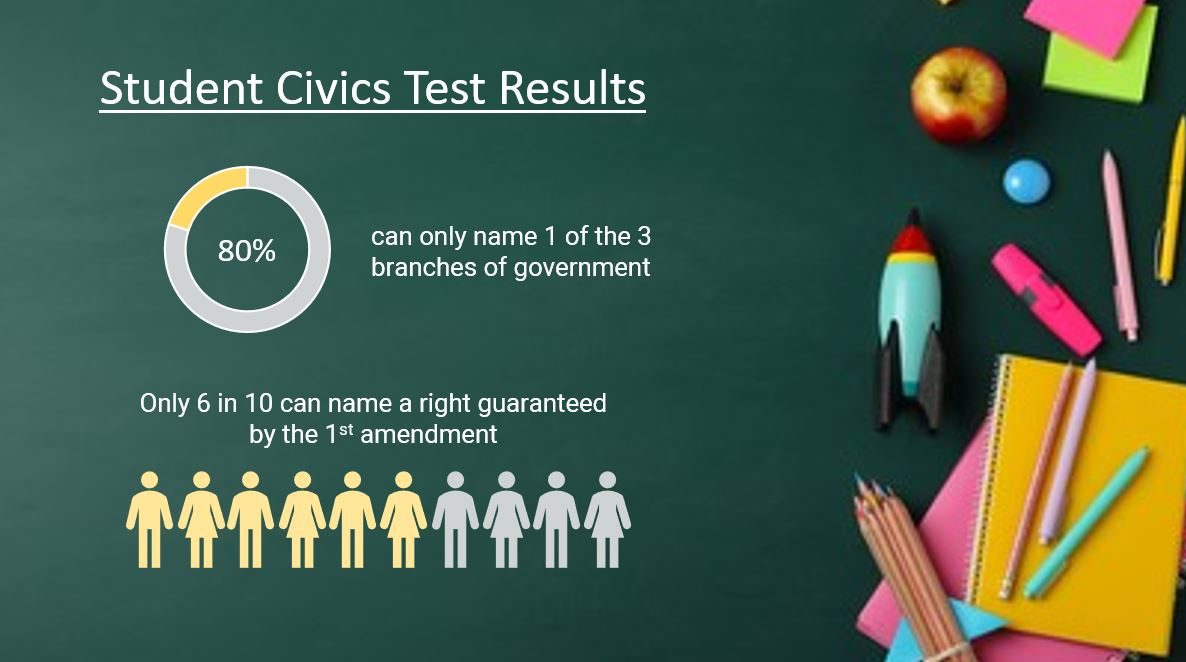
In these polarized times we could wonder whether our nation’s motto requires a revision to “E Pluribus Duo” as it seems at times we live in two separate countries. That begs the question whether we all believe that knowing who we are as a country and how our country is supposed to work is important to all of us.
To answer this question we asked our users how important Civics Education is and how much of it should be part of the curriculum of our K-12 education standards. We gave everyone five options to pick from:
- Schools should require at least a full year of civics, volunteering, a civic minded project for graduation, and make passing the citizen exam a requirement.
- All schools should require a full year of civics education as a graduation criterion.
- All schools should provide approximately 6 months of civics specific education.
- No specific civics education requirements should exist above the current social studies requirements.
- Schools should be completely free to determine how much or how little civics education they provide.
As it turns out we are remarkably unified in that we believe that civics education is important.
An overwhelming 85% majority believes that we should have at least one year of civics education in our schools. Almost half of our respondents (46%) believe that besides the 1 year of civics, kids should volunteer, complete a civics minded project and pass the citizen exam before they can graduate high school.
We found a small and interesting education-gap, in that those with the least formal education, are more strongly in favor of more civics education. Among those with only a high school diploma, a majority of 56% would support the largest requirements on civic education, while of those with a 4-year college degree or more, only 36% support that. Still, in all groups the support for at least 1 year of civics education is 83% or more.
Support for Civics education is a bipartisan issue. Republicans champion at least 1 year of Civics Education with 83%, just ahead of Democrats with 78%. Independents are most adamant with 94% that Civics is important. When we focus on whether further requirements, such as a civics minded project, volunteering and passing the citizenship test are needed, 1 out of every 2 Democrats and Independents are all for it, while among Republicans that support is still about 2 out of every 5.
All in all, the country seems united on Civics Education, which is a comforting thought. Maybe, through increased civics education, the next generations can come together to perfect our imperfect union and aspire to achieve the promise of our motto sometime in the future.