
ActiVote
← All analysis
November 5, 2025

Americans Want to End Shutdowns
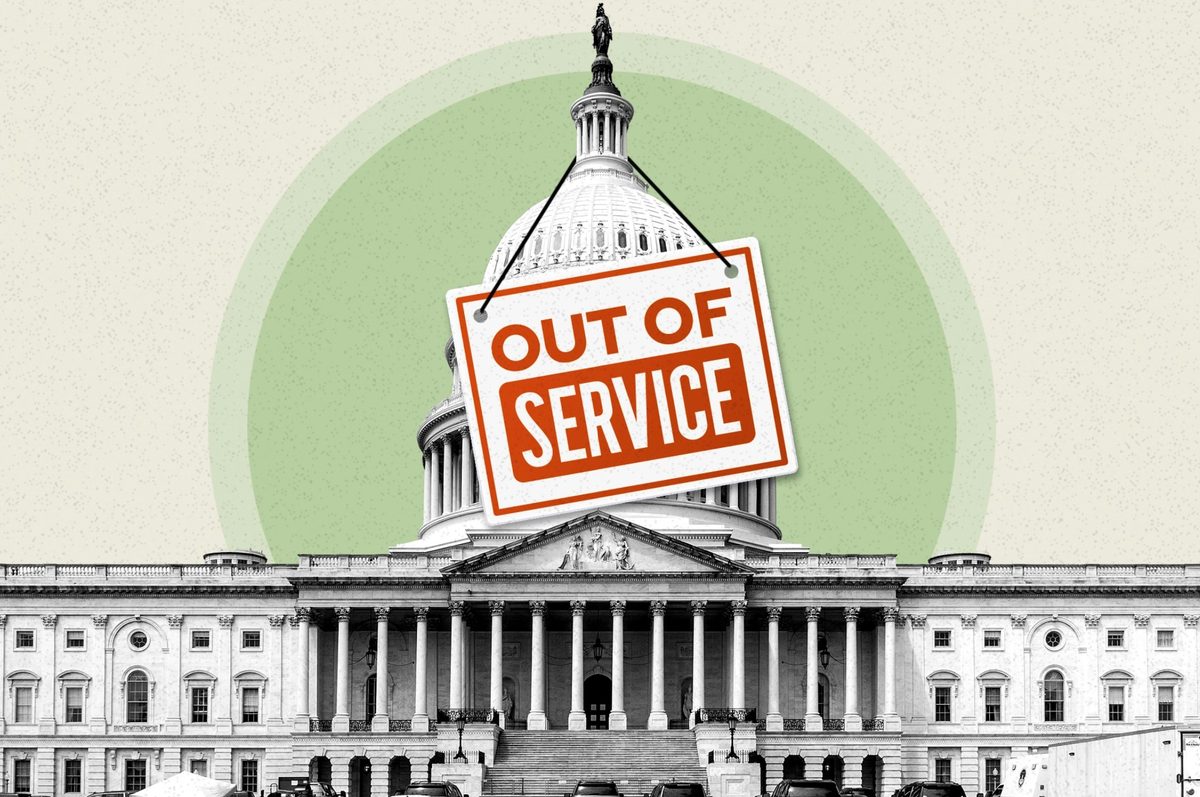
Between October 28 to November 4, 2025, ActiVote performed a survey on the ongoing government shutdown with 5 questions, each with 5 possible answers. The poll was processed using ActiVote’s standard polling methodology. The average sample size was 602 per question (ranging from a minimum of 582 to a maximum of 619) leading to an expected polling error of about 4.0%.

For each of the questions we have looked at the overall opinion of all survey takers as well as the split based on political leanings, distinguishing between the left, moderate left, center, moderate right and the right, each representing 20% of the overall population.

There is significant consensus across the electorate:

  • All sides of the spectrum want to stop paying Congress during a shutdown and want to keep paying (active-duty) military.
  • All sides of the spectrum want to change the rules to avoid shutdowns, with the left supporting that more enthusiastically than the right.

On the specific programs affected by the shutdown (ACA enhanced subsidies and SNAP), there is less common ground:

  • The left wishes to keep the enhanced ACA subsidies while the right wishes to remove them.
  • The left wishes to expand SNAP while the right wishes to make the work requirements stricter.

In other words, there are clear policy differences at play between the left and the right, but they are in agreement that a shutdown is not the way to resolve these differences.

In the next 5 sections we present the summary results per individual question.

Congress

The survey (answered by 619 people) asked: “Which of these statements best reflects your opinion on whether members of Congress should receive their salaries during a government shutdown?” and provided 5 answers:

  • Lawmakers should lose their full paycheck until the government reopens.
  • Lawmakers should lose half of their paycheck until the government reopens.
  • Lawmaker pay should be suspended until all federal workers are paid.
  • Lawmakers should individually decide whether to accept or defer pay.
  • Lawmaker pay must continue during shutdowns.
Congressional Pay during a Shutdown — the headline result
Lose pay
82%
Lose 1/2 of pay
2%
Pay suspended
12%
Individual decision
2%
Pay continues
2%
See the details below →

An overwhelming majority of 82% believe that Congress should not be paid during a government shutdown. Only 2% believe that pay should continue, which is what actually happens during current shutdowns.

Congressional Pay during a Shutdown — the crosstabs
Left
76%
15%
Moderate Left
80%
15%
Center
82%
14%
Moderate Right
88%
Right
86%
10%
Lose payLose 1/2 of payPay suspendedIndividual decisionPay continues
See the details below →

There are few topics where the left and the right agree on as fully as this question: 76% of the left believes Congress should not be paid, while 86% of the right feels the same.

Military Pay during a Shutdown

The survey (answered by 593 people) asked: “Which of these statements best reflects your opinion on whether active-duty military members should be guaranteed pay during a government shutdown?” and provided 5 answers:

  • All military pay should always continue without delay.
  • All active duty military pay should always continue without delay.
  • All military pay can be delayed somewhat, but less than other government employees.
  • All military pay should be suspended like all other government employees.
  • Military pay should be prioritized less than other government employees.
Military Pay during a Shutdown — the headline result
Pay continues
72%
Active duty pay continues
15%
Some delay acceptable
3%
Pay suspended
8%
Pay suspended without priority
2%
See the details below →

A clear majority (72%) believes that all military pay should continue without delay and 87% believes that this should at least be true for active-duty military. Only 10% believes that pay should be suspended.

Military Pay during a Shutdown — the crosstabs
Left
58%
16%
14%
Moderate Left
70%
18%
10%
Center
76%
13%
Moderate Right
79%
15%
Right
74%
15%
Pay continuesActive duty pay continuesSome delay acceptablePay suspendedPay suspended without priority
See the details below →

The left (74%) and right (89%) overwhelmingly agree that active-duty military should continue to be paid.

Affordable Care Act Subsidies

The survey (answered by 614 people) asked: “Which of these statements best reflects your views on the ACA’s enhanced health insurance subsidies?” and provided 5 answers:

  • Enhanced ACA subsidies should be made permanent.
  • Congress should extend the enhanced subsidies for several more years.
  • The program should return to its original ACA subsidy levels before the COVID-era expansion.
  • ACA subsidies should be further reduced.
  • All ACA subsidies should end.
Affordable Care Act Subsidies — the headline result
Make permanent
49%
Extend subsidies
6%
Return to original subsidies
12%
Reduce subsidies
5%
End subsidies
28%
See the details below →

A majority of 55% believes that the enhanced subsidies should be extended or even made permanent, while 33% wishes to reduce or eliminate even the original ACA subsidies.

Affordable Care Act Subsidies — the crosstabs
Left
94%
Moderate Left
81%
12%
Center
47%
10%
27%
10%
Moderate Right
16%
18%
55%
Right
12%
75%
Make permanentExtend subsidiesReturn to original subsidiesReduce subsidiesEnd subsidies
See the details below →

The left (98%) and moderate left (93%) believe virtually unanimously that the enhanced ACA subsidies should be extended or made permanent. The right (83%) and moderate right (63%) in majorities even reject the original ACA subsidies, making this a very partisan issue. The centrist agree more with the left (57%) than the right (16%).

SNAP

The survey (answered by 603 people) asked: “Which of the following statements best reflects your opinion on SNAP?” and provided 5 possible answers:

  • This program should be eliminated.
  • We should expand the work requirements linked to this program to ensure people are living up to their commitments.
  • The program should be left as is.
  • Benefits for families with children should be increased.
  • We should ensure this program is expanded and the appropriate budget is added.
SNAP — the headline result
Should be eliminated
5%
Expand work requirements
48%
Keep as is
6%
Increase benefits for families with kids
8%
Expanded with additional budget
32%
See the details below →

There are two key opinions on this topic: almost half the country (48%) believes that work requirements need to be expanded for participation in the program. Almost one third (32%) believes that we should expand the program with additional budget. Very few people want the program eliminated, kept as it is or specifically expanded for those with kids.

SNAP — the crosstabs
Left
91%
Moderate Left
26%
15%
50%
Center
67%
9%
10%
11%
Moderate Right
9%
76%
Right
19%
72%
Should be eliminatedExpand work requirementsKeep as isIncrease benefits for families with kidsExpanded with additional budget
See the details below →

The left in large majority (91%) wishes to expand the budget for SNAP, while those in the center (67%), moderate right (76%) and right (72%) all by a significant majority would like to see work requirements extended.

Shutdown Continuing Resolution

The survey (answered by 582 people) asked: “Which of the following statements best reflects your opinion on whether government shutdowns should be allowed?” and provided 5 possible answers:

  • Shutdowns should be impossible: automatic clean continuing resolutions should fund the government.
  • Automatic clean continuing resolutions should cover essential services during budget debates.
  • Shutdowns should be allowed as they are today.
  • Continuing resolutions should be limited in time and scope.
  • The government should shut down until a full budget has been passed.
Shutdown Continuing Resolution — the headline result
Shutdowns impossible
15%
Auto CR
57%
Same as today
6%
CRs limited
6%
Auto shutdown
15%
See the details below →

A large majority of 72% believes that shutdowns should be made impossible or that there should be automatic continuing resolutions that keep the government open. Only 21% want to make changes that could lead to more shutdowns.

Shutdown Continuing Resolution — the crosstabs
Left
27%
60%
Moderate Left
20%
64%
Center
14%
63%
14%
Moderate Right
57%
22%
Right
44%
12%
29%
Shutdowns impossibleAuto CRSame as todayCRs limitedAuto shutdown
See the details below →

All groups in majority wish to change the rules to avoid shutdowns, ranging from a very large majority (87%) on the left to a narrow majority (52%) on the right.

Appendix - ActiVote Polling Methodology

ActiVote collects survey responses from survey takers through the ActiVote app, both available on web and smartphone.

The survey responses are weighted based on various characteristics to ensure the sample reflects the opinion of the American public at large. Feel free to review ActiVote’s polling methodology. More information about ActiVote’s polls can be found at ActiVote’s polling page.

The Details

Every question in this piece, with its answers as asked, its breakdowns by group and its methodology.

Shutdown Continuing Resolution

Which of the following statements best reflects your opinion on whether government shutdowns should be allowed?

The full crosstab table

ActiVote · Shutdown Continuing Resolution · November 5, 2025
ActiVote 582 RV Unweighted Weighted Shutdowns impossible Auto CR Same as today CRs limited Auto shutdown
National ±4.1% MoE 100% 100% 15% 57% 6% 6% 15%
Political Spectrum Left 33% 20% 27% 60% 5% 4% 4%
Moderate Left 30% 20% 20% 64% 7% 4% 5%
Center 15% 20% 14% 63% 5% 5% 14%
Moderate Right 8% 20% 7% 57% 7% 7% 22%
Right 13% 20% 8% 44% 7% 12% 29%
Region rural 37% 31% 16% 52% 9% 6% 18%
suburban 39% 36% 12% 59% 5% 7% 17%
urban 25% 32% 18% 61% 5% 6% 10%
Age 18-29 25% 15% 11% 62% 9% 5% 13%
30-49 43% 33% 13% 59% 4% 9% 16%
50-64 18% 24% 16% 49% 11% 9% 15%
65+ 15% 28% 19% 60% 3% 3% 15%
Gender F 27% 52% 17% 66% 3% 6% 9%
M 73% 48% 13% 48% 10% 7% 22%
Affiliation D 50% 38% 24% 54% 7% 6% 9%
R 27% 33% 7% 57% 4% 7% 24%
I 21% 27% 11% 62% 7% 6% 13%
Ethnicity White 83% 67% 12% 59% 4% 7% 17%
Black 9% 12% 24% 55% 5% 8% 8%
Latino 4% 14% 8% 61% 12% 5% 14%
Income Low 18% 21% 18% 63% 3% 6% 11%
Middle 33% 42% 15% 57% 7% 9% 13%
High 49% 37% 14% 55% 7% 4% 20%
Education Highschool 24% 33% 20% 59% 7% 3% 10%
Some College 12% 23% 9% 62% 4% 9% 16%
BSC+ 64% 43% 15% 53% 7% 7% 18%
Methodology. Fielded October 28 – November 4, 2025 among 582 registered voters nationwide. Responses weighted by Demographics and Spectrum. Average expected error ±4.1%. See Why trust our polls? for the methodology, disclosures and accuracy record.

Congressional Pay during a Shutdown

Which of these statements best reflects your opinion on whether members of Congress should receive their salaries during a government shutdown?

The full crosstab table

ActiVote · Congressional Pay during a Shutdown · November 5, 2025
ActiVote 619 RV Unweighted Weighted Lose pay Lose 1/2 of pay Pay suspended Individual decision Pay continues
National ±3.9% MoE 100% 100% 82% 2% 12% 2% 2%
Political Spectrum Left 33% 20% 76% 4% 15% 0% 5%
Moderate Left 30% 20% 80% 2% 15% 2% 1%
Center 15% 20% 82% 1% 14% 2% 1%
Moderate Right 8% 20% 88% 1% 8% 2% 1%
Right 13% 20% 86% 0% 10% 1% 2%
Region rural 37% 31% 87% 3% 7% 1% 2%
suburban 39% 36% 82% 1% 12% 3% 2%
urban 25% 33% 78% 1% 18% 1% 2%
Age 18-29 25% 15% 75% 6% 10% 4% 4%
30-49 43% 32% 82% 2% 9% 3% 4%
50-64 18% 25% 82% 1% 16% 0% 1%
65+ 15% 28% 87% 0% 13% 0% 0%
Gender F 27% 53% 78% 2% 16% 2% 2%
M 73% 47% 88% 2% 8% 1% 2%
Affiliation D 50% 39% 79% 2% 13% 2% 4%
R 27% 32% 84% 1% 14% 1% 1%
I 21% 27% 84% 2% 10% 3% 1%
Ethnicity White 83% 68% 82% 3% 12% 2% 1%
Black 9% 11% 79% 0% 16% 3% 2%
Latino 4% 14% 86% 0% 7% 0% 7%
Income Low 18% 20% 83% 0% 12% 3% 2%
Middle 33% 42% 80% 3% 11% 2% 3%
High 49% 38% 84% 1% 14% 1% 1%
Education Highschool 24% 33% 85% 0% 10% 3% 2%
Some College 12% 24% 81% 0% 19% 0% 0%
BSC+ 64% 44% 81% 4% 11% 2% 3%
Methodology. Fielded October 28 – November 4, 2025 among 619 registered voters nationwide. Responses weighted by Demographics and Spectrum. Average expected error ±3.9%. See Why trust our polls? for the methodology, disclosures and accuracy record.

Military Pay during a Shutdown

Which of these statements best reflects your opinion on whether active-duty military members should be guaranteed pay during a government shutdown?

The full crosstab table

ActiVote · Military Pay during a Shutdown · November 5, 2025
ActiVote 593 RV Unweighted Weighted Pay continues Active duty pay continues Some delay acceptable Pay suspended Pay suspended without priority
National ±4.0% MoE 100% 100% 72% 15% 3% 8% 2%
Political Spectrum Left 33% 20% 58% 16% 4% 14% 7%
Moderate Left 30% 20% 70% 18% 1% 10% 1%
Center 15% 20% 76% 13% 5% 5% 0%
Moderate Right 8% 20% 79% 15% 2% 4% 1%
Right 13% 20% 74% 15% 2% 6% 2%
Region rural 37% 32% 71% 18% 3% 7% 0%
suburban 39% 36% 71% 16% 1% 9% 3%
urban 25% 32% 72% 12% 5% 7% 3%
Age 18-29 25% 15% 56% 19% 4% 16% 5%
30-49 43% 32% 67% 22% 4% 5% 2%
50-64 18% 25% 68% 19% 5% 5% 3%
65+ 15% 28% 89% 3% 0% 9% 0%
Gender F 27% 53% 72% 14% 4% 7% 2%
M 73% 47% 71% 17% 2% 9% 2%
Affiliation D 50% 39% 64% 16% 3% 14% 2%
R 27% 33% 82% 12% 1% 4% 1%
I 21% 27% 68% 19% 4% 4% 5%
Ethnicity White 83% 68% 77% 14% 2% 5% 2%
Black 9% 11% 78% 15% 0% 8% 0%
Latino 4% 14% 51% 26% 7% 13% 3%
Income Low 18% 20% 72% 12% 1% 12% 3%
Middle 33% 42% 72% 16% 3% 7% 2%
High 49% 38% 71% 17% 4% 6% 2%
Education Highschool 24% 33% 87% 10% 0% 3% 0%
Some College 12% 23% 60% 20% 3% 16% 0%
BSC+ 64% 44% 66% 17% 5% 7% 5%
Methodology. Fielded October 28 – November 4, 2025 among 593 registered voters nationwide. Responses weighted by Demographics and Spectrum. Average expected error ±4.0%. See Why trust our polls? for the methodology, disclosures and accuracy record.

Affordable Care Act Subsidies

Which of these statements best reflects your views on the ACA's enhanced health insurance subsidies?

The full crosstab table

ActiVote · Affordable Care Act Subsidies · November 5, 2025
ActiVote 614 RV Unweighted Weighted Make permanent Extend subsidies Return to original subsidies Reduce subsidies End subsidies
National ±4.0% MoE 100% 100% 49% 6% 12% 5% 28%
Political Spectrum Left 33% 20% 94% 4% 0% 2% 0%
Moderate Left 30% 20% 81% 12% 6% 1% 0%
Center 15% 20% 47% 10% 27% 6% 10%
Moderate Right 8% 20% 16% 3% 18% 8% 55%
Right 13% 20% 4% 1% 12% 8% 75%
Region rural 37% 32% 43% 3% 18% 4% 31%
suburban 39% 36% 52% 7% 7% 5% 29%
urban 25% 32% 51% 7% 13% 5% 24%
Age 18-29 25% 15% 59% 6% 15% 3% 17%
30-49 43% 32% 49% 8% 12% 5% 26%
50-64 18% 25% 36% 7% 16% 8% 34%
65+ 15% 28% 53% 2% 9% 4% 32%
Gender F 27% 53% 56% 3% 12% 5% 24%
M 73% 47% 40% 9% 13% 5% 34%
Affiliation D 50% 39% 74% 7% 4% 5% 9%
R 27% 32% 17% 5% 21% 5% 53%
I 21% 27% 49% 4% 15% 4% 27%
Ethnicity White 83% 67% 43% 7% 12% 6% 32%
Black 9% 11% 61% 13% 10% 6% 9%
Latino 4% 14% 59% 0% 16% 0% 25%
Income Low 18% 21% 60% 8% 11% 0% 21%
Middle 33% 42% 46% 5% 11% 6% 31%
High 49% 38% 45% 5% 15% 6% 28%
Education Highschool 24% 32% 44% 11% 10% 4% 31%
Some College 12% 24% 63% 0% 0% 7% 30%
BSC+ 64% 44% 44% 6% 21% 5% 25%
Methodology. Fielded October 28 – November 4, 2025 among 614 registered voters nationwide. Responses weighted by Demographics and Spectrum. Average expected error ±4.0%. See Why trust our polls? for the methodology, disclosures and accuracy record.

SNAP

Which of the following statements best reflects your opinion on SNAP?

The full crosstab table

ActiVote · SNAP · November 5, 2025
ActiVote 603 RV Unweighted Weighted Should be eliminated Expand work requirements Keep as is Increase benefits for families with kids Expanded with additional budget
National ±4.0% MoE 100% 100% 5% 48% 6% 8% 32%
Political Spectrum Left 33% 20% 0% 3% 1% 6% 91%
Moderate Left 30% 20% 0% 26% 8% 15% 50%
Center 15% 20% 3% 67% 9% 10% 11%
Moderate Right 8% 20% 9% 76% 4% 6% 5%
Right 13% 20% 19% 72% 5% 2% 2%
Region rural 37% 32% 5% 53% 4% 11% 27%
suburban 39% 36% 5% 47% 9% 8% 32%
urban 25% 33% 6% 46% 5% 6% 37%
Age 18-29 25% 15% 6% 42% 3% 8% 41%
30-49 43% 32% 9% 45% 5% 6% 34%
50-64 18% 24% 5% 56% 6% 7% 26%
65+ 15% 29% 3% 49% 8% 10% 30%
Gender F 27% 53% 4% 43% 6% 8% 39%
M 73% 47% 7% 54% 6% 8% 25%
Affiliation D 50% 39% 3% 37% 5% 9% 46%
R 27% 32% 8% 66% 7% 4% 15%
I 21% 27% 5% 46% 6% 11% 32%
Ethnicity White 83% 68% 6% 49% 5% 8% 32%
Black 9% 11% 0% 57% 11% 8% 25%
Latino 4% 14% 9% 45% 3% 10% 33%
Income Low 18% 20% 3% 50% 2% 6% 39%
Middle 33% 42% 7% 48% 6% 8% 31%
High 49% 38% 5% 49% 7% 9% 30%
Education Highschool 24% 33% 4% 40% 5% 11% 40%
Some College 12% 24% 2% 62% 0% 6% 30%
BSC+ 64% 43% 9% 47% 10% 7% 28%
Methodology. Fielded October 28 – November 4, 2025 among 603 registered voters nationwide. Responses weighted by Demographics and Spectrum. Average expected error ±4.0%. See Why trust our polls? for the methodology, disclosures and accuracy record.