
Americans Split on NYC-Owned Grocery Stores
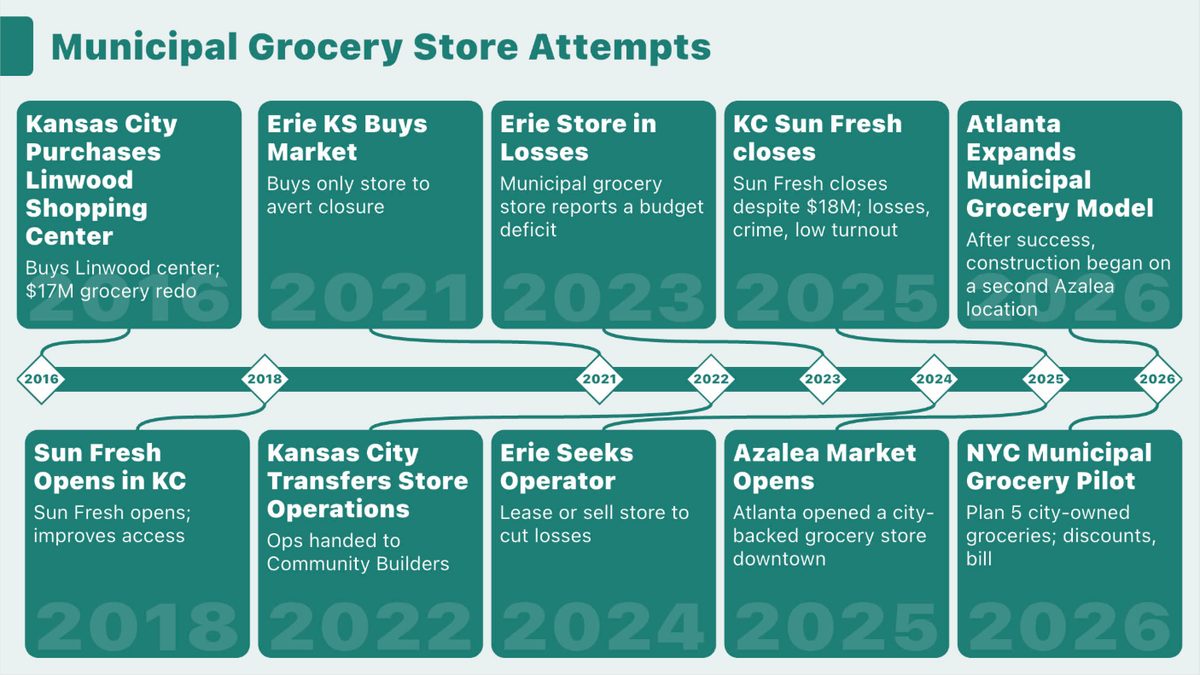
New York City officials announced plans on July 27, 2026, to open five city-owned grocery stores, one in each borough. Backed by US$70 million in capital funding, the stores would offer a 30% discount on a defined core basket of food, while private operators would manage day-to-day operations under city requirements.
Similar initiatives elsewhere have had varied outcomes. A city-backed store in Atlanta is expanding, while publicly backed stores in Kansas City and Erie, Kansas, moved to private operation after sustaining financial losses.
We wondered what Americans think about New York City’s municipal grocery stores. So we asked 602 registered voters (MoE of 4.0%) from August 10 to August 16, 2026 about it:
Which of the following statements best reflects your opinion on New York City’s municipal grocery stores?
- The city should expand beyond five stores and maintain the 30% discount
- The city should implement five stores with a 30% discount as planned
- The city should launch one pilot store before expanding further
- The city should limit the program to fewer stores with reduced discounts
- The city should not proceed with city-owned grocery stores
What voters said
The leading single answer was that the city should not proceed with city-owned grocery stores, chosen by 43%. Taken together, however, 55% selected one of the four options that would proceed with at least some version of the program.
That support did not amount to agreement on the program’s design. Implementing five stores with a 30% discount as planned received 25%, expanding beyond five stores received 17%, launching one pilot store received 12%, and limiting the program to fewer stores with reduced discounts received 1%. Another 2% selected none of the above.
Across the political spectrum
Responses changed sharply across the political spectrum. On the Left, nearly 100% favored proceeding in some form, including 55% who wanted to expand beyond five stores and 40% who supported implementing five stores as planned. Among the Moderate Left, 90% favored some version of the program, led by 51% for implementing the plan as proposed.
At the Center, 62% favored proceeding in some form, although the leading single answer was not proceeding, at 36%. Support for some version of the program then fell to 15% among the Moderate Right and 5% on the Right, while opposition rose to 80% and 93%, respectively.
Zooming out
Zooming out, the results show broader support for trying some form of New York City’s municipal grocery program than for rejecting city-owned stores outright, but little consensus on the program’s scale, discounts, or pace. They also show that views of the proposal differ substantially across the political spectrum.
See more of what America thinks in our ongoing polls.