Americans Reject U.S. Tariffs on Canada
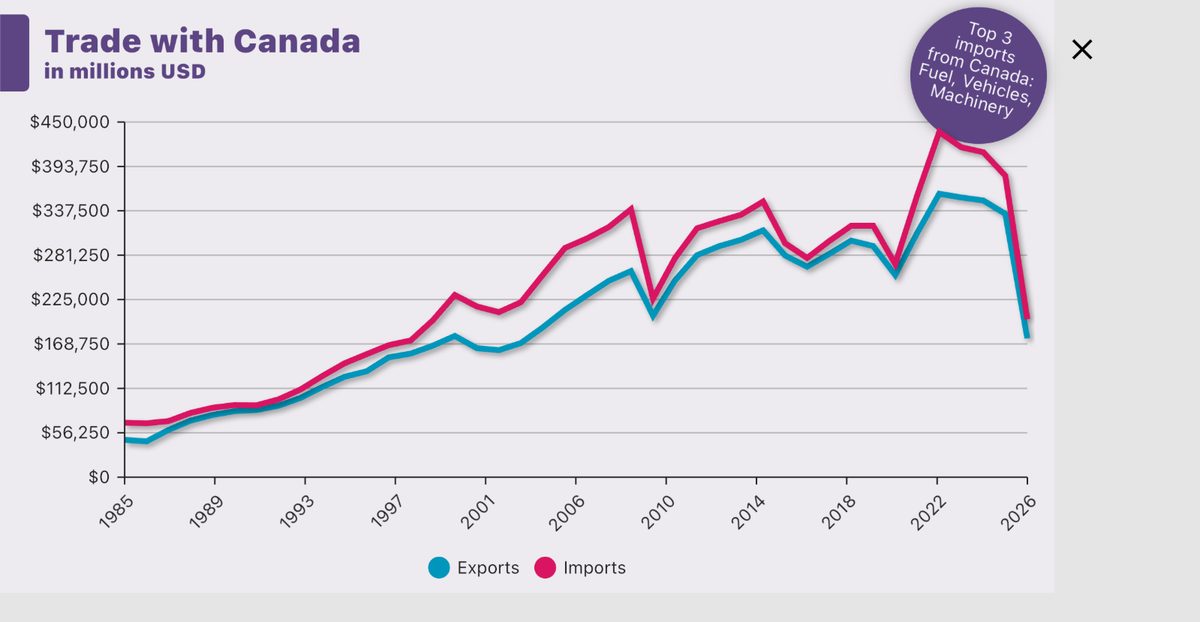
Additional 50% U.S. tariffs on selected Canadian goods took effect August 22 after trade negotiations between the two countries broke down. The tariffs apply to approximately US$20 billion in goods, including some that qualify for preferential treatment under the U.S.-Mexico-Canada Agreement, while energy, potash, fish, critical minerals, and certain other products are excluded.
The United States says the measures respond to discriminatory treatment of U.S. products. Canada says its vehicle tariffs and alcohol restrictions were countermeasures against earlier U.S. tariffs and has announced retaliatory tariffs of equivalent economic value beginning September 8.
We wondered what Americans think about U.S. tariffs on Canadian imports. So we asked 667 registered voters (MoE of 3.8%) from August 24 to 30, 2026 about it:
Which of the following statements best reflects your opinion on the U.S. tariffs on Canadian imports?
- Strongly approve
- Approve
- Neutral
- Disapprove
- Strongly disapprove
What voters said
“Strongly disapprove” was the leading answer at 54%. Together with the 11% who selected “Disapprove,” 65% expressed disapproval of the tariffs. In comparison, 26% approved or strongly approved.
Another 7% were neutral, and 2% selected none of the listed answers. The distribution was therefore lopsided rather than closely split, with the strongest form of disapproval alone receiving a majority.
Across the political spectrum
Views shifted sharply from Left to Right. Combined disapproval reached 99% on the Left, 94% among the Moderate Left, and 72% in the Center. Strong disapproval alone accounted for 96% on the Left and 55% in the Center.
Farther right, approval became more common. Among the Moderate Right, 48% approved or strongly approved, compared with 34% who disapproved or strongly disapproved. On the Right, combined approval reached 64%, including 44% who strongly approved, while combined disapproval stood at 25%.
Crosstabs
Zooming out
This is not a new quarrel about tariffs. In last fall’s survey on tariff policy, a majority still regarded tariffs as a legitimate economic tool but wanted the United States to use fewer of them than it was using at the time. In our April survey on executive actions, 55% wanted most or all of the administration’s tariff expansions rolled back. What this week’s result adds is a specific target: Canada, including Canadian goods that qualify under the U.S.-Mexico-Canada Agreement. That distinction matters. Americans may accept tariffs in principle while rejecting their use against a close ally whose goods already comply with a trade agreement negotiated by the United States. The question this week was not simply whether tariffs can work, but whether they belong on Canada. Sixty-five percent of Americans answered no.
See more of what America thinks in our ongoing polls.
 | 667 RV | Unweighted | Weighted | Strongly approve | Approve | Neutral | Disapprove | Strongly disapprove | None of the above |
|---|---|---|---|---|---|---|---|---|---|
| National | ±3.8% MoE | 100% | 100% | 16% | 10% | 7% | 11% | 54% | 2% |
| Political Spectrum | Left | 31% | 20% | 0% | 0% | 1% | 3% | 96% | 0% |
| Moderate Left | 30% | 20% | 2% | 1% | 2% | 6% | 88% | 0% | |
| Center | 16% | 20% | 7% | 9% | 11% | 17% | 55% | 1% | |
| Moderate Right | 11% | 20% | 28% | 20% | 15% | 16% | 18% | 4% | |
| Right | 12% | 20% | 44% | 20% | 7% | 14% | 12% | 3% | |
| Region | rural | 38% | 34% | 19% | 12% | 12% | 10% | 45% | 2% |
| suburban | 33% | 30% | 20% | 8% | 6% | 9% | 56% | 2% | |
| urban | 29% | 35% | 11% | 10% | 4% | 13% | 61% | 1% | |
| Age | 18-29 | 31% | 16% | 12% | 6% | 9% | 13% | 60% | 0% |
| 30-49 | 38% | 32% | 9% | 6% | 6% | 19% | 56% | 4% | |
| 50-64 | 16% | 23% | 22% | 7% | 14% | 5% | 50% | 2% | |
| 65+ | 15% | 28% | 22% | 19% | 2% | 6% | 50% | 0% | |
| Gender | F | 24% | 53% | 18% | 8% | 9% | 7% | 58% | 0% |
| M | 76% | 47% | 14% | 12% | 6% | 15% | 49% | 4% | |
| Affiliation | D | 43% | 36% | 3% | 0% | 4% | 7% | 86% | 0% |
| R | 22% | 31% | 36% | 24% | 14% | 10% | 15% | 0% | |
| I | 29% | 30% | 14% | 9% | 4% | 13% | 54% | 6% | |
| Ethnicity | White | 84% | 66% | 19% | 10% | 9% | 10% | 50% | 1% |
| Black | 8% | 11% | 18% | 0% | 6% | 12% | 64% | 0% | |
| Latino | 5% | 15% | 10% | 20% | 0% | 9% | 56% | 5% | |
| Income | Low | 26% | 25% | 12% | 11% | 8% | 8% | 56% | 4% |
| Middle | 31% | 30% | 21% | 12% | 8% | 9% | 49% | 1% | |
| High | 43% | 44% | 15% | 8% | 6% | 14% | 56% | 1% | |
| Education | Highschool | 21% | 26% | 20% | 13% | 9% | 5% | 54% | 0% |
| Some College | 67% | 60% | 13% | 11% | 8% | 12% | 54% | 1% | |
| BSC+ | 12% | 14% | 24% | 0% | 3% | 17% | 50% | 6% |