
ActiVote
← All analysis
October 20, 2025

AllSides/ActiVote Survey on Tariffs
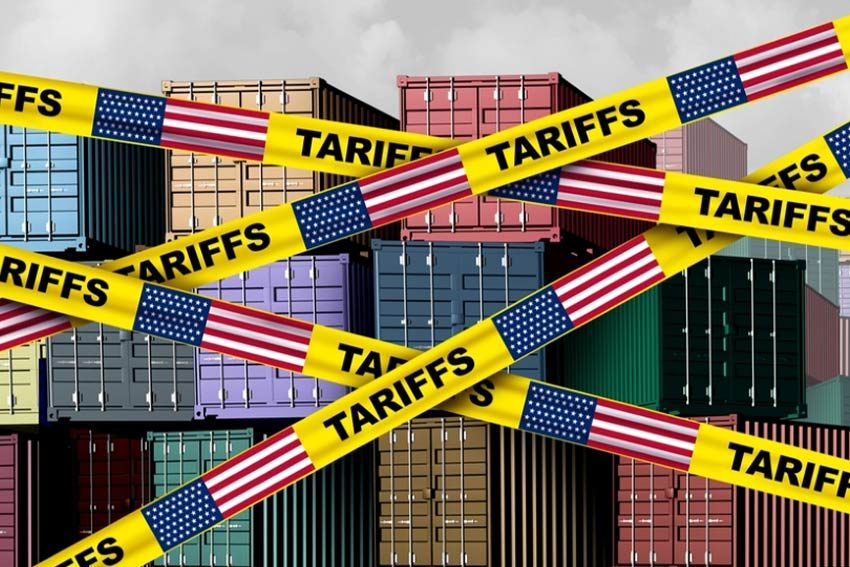
In October 2025, AllSides and ActiVote collaborated on a survey on tariffs with 9 questions, each with 5 possible answers. The poll was processed using ActiVote’s standard polling methodology (details in appendix A). The average sample size was 609 per question (ranging from a minimum of 486 to a maximum of 703) leading to an expected polling error of about 4.0%. We invite you to participate in this survey if you have not already.

For each of the questions we have looked at the overall opinion of all survey takers as well as the split based on political leanings, distinguishing between the left, moderate left, center, moderate right and the right, each representing 20% of the overall population.

A few clear trends are visible from the survey:

  • The left is much less enamored with tariffs than the right.
  • A majority believes that tariffs should be a tool in the economic toolbox.
  • A majority believes that we should balance keeping prices low with projecting jobs.
  • A large majority believes lobbying and corruption are a (very) serious problem related to tariffs.
  • A majority believes the U.S. should stand up to China, though opinions differ on how.
  • A majority believes we should reduce tariffs in the coming period.

In line with the overall less appetite for tariffs on the left than on the right:

  • The left is more concerned about retaliation when the U.S. imposes tariffs than the right.
  • The right is more willing to use tariffs for national security purposes.
  • The right is more willing to use tariffs for political leverage.
  • The right would like to increase tariff revenue, while the left prefers reducing it.

In summary, while the country as a whole would like to reduce the use of tariffs compared to current Trump administration policy, there is significant support among Trump’s base (the right and moderate right) for his tariff policies: to use it for political leverage, to first and foremost protect jobs, to stand up to China, to generate more revenue, and for national security purposes, even if they believe that lobbying and corruption are serious problems.

In the next 9 sections we present the summary results per individual question.

Tariffs

The survey (answered by 492 people) asked: “Which of these statements best reflects your opinion on the use of tariffs?” and provided 5 answers:

  • Tariffs should never be used.
  • Tariffs should only be used in response to dumping of large amounts of discounted products.
  • Tariffs should be used whenever a specific domestic industry is struggling.
  • Tariffs should be used as economic policy to stimulate and protect selected domestic industries.
  • Tariffs should be used on all foreign imports.
Tariffs — the headline result
Used on all imports
14%
Used to stimulate and protect domestic industries
52%
Used to protect struggling domestic industry
7%
Used in response to dumping
18%
Never used
9%
See the details below →

A majority of 52% favor using tariffs to stimulate and protect domestic industries, while another 14% would like to use it on all imports, which means about ⅔ view tariffs as an effective economic tool, while only ⅓ believe they should be used sparingly (either never, in a specific response to dumping or to protect a specific domestic industry).

Tariffs — the crosstabs
Left
36%
10%
36%
18%
Moderate Left
51%
9%
25%
11%
Center
10%
54%
10%
16%
9%
Moderate Right
24%
65%
Right
29%
59%
Used on all importsUsed to stimulate and protect domestic industriesUsed to protect struggling domestic industryUsed in response to dumpingNever used
See the details below →

The left is much more reluctant to use tariffs: 64% believe it should be used sparingly (never, against dumping or in protection of specific industries). The right is almost unanimous (88%) in their support of using tariffs as an economic tool.

Tariffs: Consumers vs. Jobs Tradeoff

The survey (answered by 703 people) asked: “Which of these statements best reflects your opinion on the consumers vs. jobs tradeoff?” and provided 5 answers:

  • Protecting American jobs should be the top priority.
  • Protecting jobs is more important than keeping prices low.
  • Protecting jobs is as important as keeping prices low.
  • Keeping prices low is more important than protecting jobs.
  • Keeping prices low should be the top priority.
Tariffs: Consumers vs. Jobs Tradeoff — the headline result
Jobs first
10%
Jobs more important
8%
Equally important
68%
Prices more important
7%
Prices first
6%
See the details below →

A clear majority (68%) believes that we should balance keeping prices low and protecting jobs. Those who believe low prices should be prioritized (13%) are approximately in balance with those who believe that protecting jobs is more important (18%).

Tariffs: Consumers vs. Jobs Tradeoff — the crosstabs
Left
75%
10%
Moderate Left
76%
9%
Center
9%
68%
Moderate Right
15%
71%
Right
20%
16%
57%
Jobs firstJobs more importantEqually importantPrices more importantPrices first
See the details below →

All groups in majority believe that keeping prices low and protecting jobs is equally important. Protecting jobs over lower prices is a more prevalent opinion on the (moderate) right.

Trade with China

The survey (answered by 486 people) asked: “Which of these statements best reflects your views on trade with China?” and provided 5 answers:

  • We should continue to trade with China in a free market system.
  • We should continue trading with China, however, we should challenge bad practices (like IP infringement and human rights violations) to ensure that over time they will improve in those areas.
  • We should strongly challenge any wrong-doing including sanctioning individual Chinese companies, as well as the Chinese government.
  • We should start a trade war using tariffs to get China to change its ways.
  • We should, as much as possible, reduce trade with China to a fraction of what it is today.
Trade with China — the headline result
Significantly reduce trade with China
36%
Start trade war
3%
Sanction bad actors
25%
Challenge bad practices
33%
Free market trade with China
2%
See the details below →

Virtually no one believes the U.S. should start a trade war or pursue a completely free-market trade system with China. The three main opinions are: to significantly reduce trade with China (36%), to challenge bad practices (33%) and to sanction bad actors within China (25%).

Trade with China — the crosstabs
Left
16%
75%
Moderate Left
9%
49%
40%
Center
26%
35%
27%
Moderate Right
37%
33%
29%
Right
76%
14%
Significantly reduce trade with ChinaStart trade warSanction bad actorsChallenge bad practicesFree market trade with China
See the details below →

The left is more focused on challenging bad practices, while the right is more focused on significantly reducing trade.

Tariffs and National Security

The survey (answered by 667 people) asked: “Which of the following statements best reflects your opinion on tariffs and national security?” and provided 5 possible answers:

  • The U.S. should almost always use tariffs to protect national security industries.
  • The U.S. should frequently use tariffs for national security.
  • The U.S. should sometimes use tariffs for national security.
  • The U.S. should exceptionally use tariffs for national security.
  • The U.S. should never use tariffs for national security.
Tariffs and National Security — the headline result
Always for security
20%
Frequently for security
13%
Sometimes for security
27%
Exceptionally for security
31%
Never for security
9%
See the details below →

The country was split on this topic, with each of the answers receiving between 9% and 31% of the vote. Slightly more people (40%) believe that tariffs should rarely or never be used for National Security, compared to those (33%) who believe that tariffs should frequently or always be used for National Security reasons.

Tariffs and National Security — the crosstabs
Left
29%
41%
18%
Moderate Left
9%
32%
42%
9%
Center
15%
17%
28%
29%
11%
Moderate Right
29%
21%
24%
21%
Right
38%
16%
21%
21%
Always for securityFrequently for securitySometimes for securityExceptionally for securityNever for security
See the details below →

The right is more in favor of using tariffs for National Security than the left.

Tariffs as Political Leverage

The survey (answered by 657 people) asked: “Which of the following statements best reflects your opinion on using tariffs for political leverage?” and provided 5 possible answers:

  • The U.S. can at any time use tariffs as a foreign policy tool.
  • The U.S. should frequently use tariffs as a foreign policy tool.
  • The U.S. should sometimes use tariffs for foreign policy.
  • The U.S. should rarely use tariffs for foreign policy.
  • The U.S. should never use tariffs for foreign policy purposes.
Tariffs as Political Leverage — the headline result
Always
21%
Frequently
5%
Sometimes
27%
Rarely
36%
Never
11%
See the details below →

Almost half (47%) believe that we should rarely or never use tariffs for political leverage, while 26% believe we should do so frequently or always. The final 27% believes we should do so sometimes.

Tariffs as Political Leverage — the crosstabs
Left
15%
59%
21%
Moderate Left
22%
54%
16%
Center
21%
32%
35%
Moderate Right
33%
40%
17%
Right
41%
33%
15%
AlwaysFrequentlySometimesRarelyNever
See the details below →

Of those on the left, 80% believe that tariffs should rarely or never be used for political leverage, while almost half (49%) of those on the right are happy to use it frequently or always.

Tariffs and Retaliation

The survey (answered by 645 people) asked: “Which of the following statements best reflects your opinion on tariffs and retaliation?” and provided 5 possible answers:

  • The U.S. should ignore retaliation in its tariff decisions.
  • The U.S. should give little weight to retaliation in its tariff decisions.
  • The U.S. should consider retaliation in its tariff decisions.
  • The U.S. should strongly consider retaliation in its tariff decisions.
  • The U.S. should avoid tariffs because of the possibility of retaliation.
Tariffs and Retaliation — the headline result
Ignore retaliation
8%
Little weight
15%
Consider retaliation
29%
Strongly consider
36%
Avoid tariffs
11%
See the details below →

Almost half (47%) believe that retaliation should be considered strongly or tariffs should be avoided completely because of the risk of retaliation. Only 23% believe that the possibility of retaliation should be given little or no weight.

Tariffs and Retaliation — the crosstabs
Left
10%
18%
42%
22%
Moderate Left
12%
25%
39%
18%
Center
17%
30%
35%
11%
Moderate Right
18%
35%
34%
Right
10%
19%
38%
33%
Ignore retaliationLittle weightConsider retaliationStrongly considerAvoid tariffs
See the details below →

The left is more sensitive to retaliation, with 64% wishing to consider it strongly or avoiding tariffs at all. On the right only 33% have the same opinion.

Tariffs as Government Revenue

The survey (answered by 616 people) asked: “Which of these statements best reflects your opinion on using tariffs as a source of government revenue?” and provided five possible answers:

  • Tariffs should replace all other sources of government revenue.
  • Tariffs should provide significantly more revenue than in recent decades.
  • Tariffs should provide about the same share of revenue as they do now.
  • Tariffs should provide less revenue than in recent decades.
  • Tariffs should be almost entirely eliminated.
Tariffs as Government Revenue — the headline result
Tariffs as all revenue
8%
Tariffs as more revenue
30%
Same as today
25%
Tariffs as less revenue
10%
Eliminate
26%
See the details below →

Almost the same number of people believe that we should reduce government revenue through tariffs (36%) as those who believe we should increase government revenue through tariffs (38%). The remaining 25% believe it should stay the same as it is today.

Tariffs as Government Revenue — the crosstabs
Left
28%
21%
43%
Moderate Left
13%
30%
14%
41%
Center
29%
34%
27%
Moderate Right
12%
64%
10%
11%
Right
20%
52%
18%
Tariffs as all revenueTariffs as more revenueSame as todayTariffs as less revenueEliminate
See the details below →

A majority of the left (64%) wishes to reduce tariff revenue, while a majority of the right (72%) wishes to increase tariff revenue.

Tariffs: Future Direction

The survey (answered by 612 people) asked: “Which of the following statements best reflects your opinion on the overall direction the U.S. should take with tariffs?” and provided 5 answers:

  • The U.S. should expand tariffs significantly beyond current levels.
  • The U.S. should expand tariffs somewhat in selected industries.
  • The U.S. should maintain tariffs at about current levels (as set by Trump in 2025).
  • The U.S. should reduce tariffs in many industries from current levels.
  • The U.S. should remove most if not all tariffs.
Tariffs: Future Direction — the headline result
Expand tariffs
9%
Expand selectively
15%
Maintain tariffs
18%
Reduce tariffs
33%
Remove tariffs
24%
See the details below →

A majority (57%) believes we should reduce or remove tariffs, while about ¼ thinks that we should expand tariffs. The remaining 18% believes that the current level of tariffs are about right.

Tariffs: Future Direction — the crosstabs
Left
49%
44%
Moderate Left
44%
40%
Center
20%
15%
38%
21%
Moderate Right
17%
20%
41%
14%
Right
22%
25%
30%
17%
Expand tariffsExpand selectivelyMaintain tariffsReduce tariffsRemove tariffs
See the details below →

The left is virtually unanimous (93%) that we should reduce or remove tariffs, while on the right only a minority of 23% has the same opinion. On the right almost half (47%) believe we should further expand tariffs.

Tariffs: Corruption and Lobbying

The survey (answered by 601 people) asked: “Which of the following statements best reflects your opinion on corruption and lobbying?” and provided 5 answers:

  • Lobbying and corruption are a very serious problem with tariffs.
  • Lobbying and corruption are a serious problem with tariffs.
  • Lobbying and corruption are somewhat of a problem with tariffs.
  • Lobbying and corruption are not much of a problem with tariffs.
  • Lobbying and corruption are not a problem at all with tariffs.
Tariffs: Corruption and Lobbying — the headline result
No problem
2%
Not much of a problem
7%
Somewhat of a problem
10%
Serious
13%
Very serious
68%
See the details below →

A majority (81%) believes that corruption and lobbying are a (very) serious problem, with 68% seeing it as a very serious problem.

Tariffs: Corruption and Lobbying — the crosstabs
Left
10%
84%
Moderate Left
11%
81%
Center
16%
65%
Moderate Right
10%
18%
63%
Right
10%
22%
17%
49%
No problemNot much of a problemSomewhat of a problemSeriousVery serious
See the details below →

Both the left (94%) and the right (66%) in majority believe that corruption and lobbying is a serious or very serious problem regarding tariffs.

Appendix A - Tariffs Survey Content

Each of the participants was provided with optional background information on each of these policy topics before responding. We encourage you to review the survey in detail if you have questions on what each participant read.

Appendix B - ActiVote Polling Methodology

ActiVote collects survey responses from survey takers through the ActiVote app, both available on web and smartphone (the vast majority of participants in this survey used the web version).The survey responses are weighted based on various characteristics to ensure the sample reflects the opinion of the American public at large. Feel free to review ActiVote’s polling methodology. More information about ActiVote’s polls can be found at ActiVote’s polling page.

The Details

Every question in this piece, with its answers as asked, its breakdowns by group and its methodology.

Tariffs

Which of these statements best reflects your opinion on the use of tariffs?

The full crosstab table

ActiVote · Tariffs · October 20, 2025
ActiVote 492 RV Unweighted Weighted Used on all imports Used to stimulate and protect domestic industries Used to protect struggling domestic industry Used in response to dumping Never used
National ±4.4% MoE 100% 100% 14% 52% 7% 18% 9%
Political Spectrum Left 38% 20% 1% 36% 10% 36% 18%
Moderate Left 28% 20% 2% 51% 9% 25% 11%
Center 13% 20% 10% 54% 10% 16% 9%
Moderate Right 6% 20% 24% 65% 2% 5% 5%
Right 14% 20% 29% 59% 4% 5% 2%
Region rural 41% 32% 13% 53% 4% 22% 8%
suburban 38% 35% 28% 49% 5% 14% 5%
urban 21% 33% 0% 55% 13% 19% 13%
Age 18-29 28% 15% 16% 54% 7% 8% 15%
30-49 40% 32% 15% 49% 10% 16% 10%
50-64 16% 24% 10% 51% 9% 27% 4%
65+ 17% 29% 16% 55% 2% 18% 8%
Gender F 33% 54% 18% 50% 8% 16% 9%
M 67% 46% 10% 54% 6% 21% 8%
Affiliation D 55% 39% 7% 50% 9% 19% 14%
R 21% 33% 27% 55% 6% 10% 3%
I 23% 27% 8% 52% 5% 28% 7%
Ethnicity White 79% 66% 17% 50% 2% 23% 8%
Black 12% 12% 0% 68% 4% 23% 5%
Latino 5% 15% 20% 64% 5% 0% 11%
Income Low 19% 22% 14% 54% 4% 24% 5%
Middle 35% 41% 17% 44% 10% 16% 12%
High 47% 38% 11% 59% 6% 17% 7%
Education Highschool 28% 31% 14% 63% 7% 13% 3%
Some College 15% 25% 13% 52% 4% 12% 20%
BSC+ 57% 45% 15% 44% 9% 25% 6%
Methodology. Fielded October 2025 among 492 registered voters nationwide. Responses weighted by Demographics and Spectrum. Average expected error ±4.4%. See Why trust our polls? for the methodology, disclosures and accuracy record.

Tariffs: Consumers vs. Jobs Tradeoff

Which of these statements best reflects your opinion on the consumers vs. jobs tradeoff?

The full crosstab table

ActiVote · Tariffs: Consumers vs. Jobs Tradeoff · October 20, 2025
ActiVote 703 RV Unweighted Weighted Jobs first Jobs more important Equally important Prices more important Prices first
National ±3.7% MoE 100% 100% 10% 8% 68% 7% 6%
Political Spectrum Left 33% 20% 3% 4% 75% 10% 7%
Moderate Left 30% 20% 4% 5% 76% 9% 6%
Center 16% 20% 9% 7% 68% 8% 7%
Moderate Right 8% 20% 15% 6% 71% 3% 5%
Right 13% 20% 20% 16% 57% 5% 2%
Region rural 36% 31% 11% 10% 58% 9% 12%
suburban 39% 36% 16% 7% 70% 4% 3%
urban 24% 32% 4% 8% 76% 9% 3%
Age 18-29 25% 15% 9% 4% 70% 10% 7%
30-49 42% 32% 13% 9% 60% 8% 10%
50-64 18% 25% 6% 7% 71% 10% 5%
65+ 16% 29% 13% 10% 74% 3% 1%
Gender F 29% 53% 10% 11% 70% 3% 7%
M 71% 47% 11% 6% 66% 12% 5%
Affiliation D 46% 39% 9% 3% 72% 9% 8%
R 30% 32% 16% 15% 63% 3% 3%
I 22% 27% 8% 9% 70% 8% 5%
Ethnicity White 82% 67% 14% 11% 64% 6% 5%
Black 8% 11% 5% 0% 68% 18% 8%
Latino 5% 14% 4% 5% 91% 0% 0%
Income Low 19% 21% 9% 11% 68% 7% 4%
Middle 34% 42% 9% 6% 69% 7% 8%
High 47% 38% 13% 9% 67% 7% 4%
Education Highschool 25% 33% 9% 9% 77% 4% 1%
Some College 12% 23% 9% 5% 72% 15% 0%
BSC+ 63% 44% 12% 9% 60% 6% 12%
Methodology. Fielded October 2025 among 703 registered voters nationwide. Responses weighted by Demographics and Spectrum. Average expected error ±3.7%. See Why trust our polls? for the methodology, disclosures and accuracy record.

Trade with China

Which of these statements best reflects your views on trade with China?

The full crosstab table

ActiVote · Trade with China · October 20, 2025
ActiVote 486 RV Unweighted Weighted Significantly reduce trade with China Start trade war Sanction bad actors Challenge bad practices Free market trade with China
National ±4.4% MoE 100% 100% 36% 3% 25% 33% 2%
Political Spectrum Left 40% 20% 1% 0% 16% 75% 8%
Moderate Left 27% 20% 9% 1% 49% 40% 0%
Center 14% 20% 26% 8% 35% 27% 3%
Moderate Right 5% 20% 37% 1% 33% 29% 0%
Right 14% 20% 76% 2% 14% 7% 0%
Region rural 44% 31% 23% 7% 27% 38% 5%
suburban 37% 37% 39% 3% 22% 35% 1%
urban 19% 32% 45% 0% 28% 26% 1%
Age 18-29 25% 14% 31% 11% 22% 29% 6%
30-49 44% 32% 26% 5% 22% 43% 5%
50-64 19% 26% 31% 0% 37% 32% 0%
65+ 12% 29% 53% 0% 21% 25% 0%
Gender F 35% 53% 42% 4% 17% 33% 4%
M 65% 47% 29% 2% 35% 32% 1%
Affiliation D 55% 39% 31% 0% 26% 40% 3%
R 18% 33% 49% 0% 28% 19% 3%
I 26% 26% 23% 12% 23% 41% 1%
Ethnicity White 83% 67% 36% 5% 23% 34% 2%
Black 8% 12% 33% 0% 23% 45% 0%
Latino 4% 14% 59% 0% 20% 21% 0%
Income Low 18% 21% 35% 0% 14% 46% 5%
Middle 37% 42% 34% 7% 29% 27% 1%
High 45% 37% 38% 0% 27% 32% 2%
Education Highschool 26% 32% 44% 0% 27% 29% 0%
Some College 8% 24% 46% 0% 16% 37% 0%
BSC+ 66% 44% 24% 7% 30% 33% 6%
Methodology. Fielded October 2025 among 486 registered voters nationwide. Responses weighted by Demographics and Spectrum. Average expected error ±4.4%. See Why trust our polls? for the methodology, disclosures and accuracy record.

Tariffs and National Security

Which of the following statements best reflects your opinion on tariffs and national security?

The full crosstab table

ActiVote · Tariffs and National Security · October 20, 2025
ActiVote 667 RV Unweighted Weighted Always for security Frequently for security Sometimes for security Exceptionally for security Never for security
National ±3.8% MoE 100% 100% 20% 13% 27% 31% 9%
Political Spectrum Left 33% 20% 7% 5% 29% 41% 18%
Moderate Left 30% 20% 8% 9% 32% 42% 9%
Center 15% 20% 15% 17% 28% 29% 11%
Moderate Right 8% 20% 29% 21% 24% 21% 6%
Right 13% 20% 38% 16% 21% 21% 3%
Region rural 37% 32% 24% 18% 21% 27% 10%
suburban 39% 36% 21% 11% 30% 30% 9%
urban 25% 33% 16% 9% 31% 35% 9%
Age 18-29 25% 14% 13% 9% 28% 34% 15%
30-49 43% 33% 20% 8% 36% 26% 11%
50-64 18% 25% 17% 9% 32% 31% 11%
65+ 15% 28% 27% 24% 13% 34% 3%
Gender F 27% 53% 23% 12% 22% 34% 9%
M 73% 47% 17% 13% 33% 27% 10%
Affiliation D 50% 39% 9% 7% 30% 38% 15%
R 27% 32% 38% 18% 19% 21% 4%
I 21% 26% 16% 11% 35% 31% 8%
Ethnicity White 83% 67% 25% 14% 23% 31% 7%
Black 9% 11% 5% 8% 41% 37% 9%
Latino 4% 14% 20% 5% 40% 35% 0%
Income Low 18% 20% 21% 14% 22% 35% 8%
Middle 33% 41% 19% 11% 27% 28% 14%
High 49% 38% 21% 13% 31% 30% 5%
Education Highschool 24% 33% 9% 30% 26% 30% 5%
Some College 12% 22% 26% 2% 18% 42% 12%
BSC+ 64% 44% 25% 5% 33% 25% 11%
Methodology. Fielded October 2025 among 667 registered voters nationwide. Responses weighted by Demographics and Spectrum. Average expected error ±3.8%. See Why trust our polls? for the methodology, disclosures and accuracy record.

Tariffs as Political Leverage

Which of the following statements best reflects your opinion on using tariffs for political leverage?

The full crosstab table

ActiVote · Tariffs as Political Leverage · October 20, 2025
ActiVote 657 RV Unweighted Weighted Always Frequently Sometimes Rarely Never
National ±3.8% MoE 100% 100% 21% 5% 27% 36% 11%
Political Spectrum Left 34% 20% 3% 2% 15% 59% 21%
Moderate Left 30% 20% 4% 4% 22% 54% 16%
Center 16% 20% 21% 4% 32% 35% 8%
Moderate Right 8% 20% 33% 7% 40% 17% 4%
Right 13% 20% 41% 8% 33% 15% 4%
Region rural 38% 32% 18% 8% 24% 39% 10%
suburban 37% 36% 29% 4% 19% 39% 10%
urban 25% 33% 16% 3% 38% 30% 13%
Age 18-29 26% 15% 14% 5% 28% 43% 9%
30-49 43% 32% 23% 4% 24% 38% 12%
50-64 15% 25% 28% 2% 22% 35% 13%
65+ 16% 28% 17% 8% 34% 32% 8%
Gender F 29% 53% 18% 5% 29% 36% 12%
M 71% 47% 25% 5% 25% 37% 10%
Affiliation D 50% 39% 12% 5% 25% 40% 18%
R 26% 32% 39% 9% 30% 19% 3%
I 22% 27% 15% 1% 26% 49% 9%
Ethnicity White 84% 67% 24% 6% 24% 36% 9%
Black 8% 11% 23% 8% 27% 33% 9%
Latino 4% 14% 16% 0% 42% 35% 7%
Income Low 18% 21% 17% 5% 40% 31% 8%
Middle 34% 42% 17% 4% 21% 44% 14%
High 48% 38% 28% 5% 27% 31% 9%
Education Highschool 23% 33% 34% 7% 16% 32% 11%
Some College 12% 23% 12% 0% 31% 47% 10%
BSC+ 65% 45% 16% 6% 33% 34% 11%
Methodology. Fielded October 2025 among 657 registered voters nationwide. Responses weighted by Demographics and Spectrum. Average expected error ±3.8%. See Why trust our polls? for the methodology, disclosures and accuracy record.

Tariffs and Retaliation

Which of the following statements best reflects your opinion on tariffs and retaliation?

The full crosstab table

ActiVote · Tariffs and Retaliation · October 20, 2025
ActiVote 645 RV Unweighted Weighted Ignore retaliation Little weight Consider retaliation Strongly consider Avoid tariffs
National ±3.9% MoE 100% 100% 8% 15% 29% 36% 11%
Political Spectrum Left 33% 20% 7% 10% 18% 42% 22%
Moderate Left 30% 20% 6% 12% 25% 39% 18%
Center 16% 20% 8% 17% 30% 35% 11%
Moderate Right 7% 20% 8% 18% 35% 34% 6%
Right 14% 20% 10% 19% 38% 33% 0%
Region rural 38% 32% 5% 16% 29% 37% 13%
suburban 38% 36% 12% 13% 36% 31% 8%
urban 24% 32% 7% 17% 20% 42% 14%
Age 18-29 24% 15% 7% 15% 22% 43% 13%
30-49 43% 32% 13% 12% 35% 28% 12%
50-64 17% 25% 6% 19% 26% 35% 13%
65+ 16% 27% 6% 15% 27% 44% 8%
Gender F 28% 53% 8% 15% 26% 39% 11%
M 72% 47% 8% 15% 31% 33% 12%
Affiliation D 46% 38% 7% 15% 15% 47% 16%
R 32% 32% 9% 21% 28% 37% 4%
I 20% 27% 10% 9% 48% 23% 10%
Ethnicity White 84% 67% 9% 19% 31% 31% 11%
Black 8% 11% 5% 16% 15% 55% 9%
Latino 4% 14% 11% 5% 36% 39% 8%
Income Low 18% 21% 6% 14% 32% 38% 10%
Middle 33% 42% 10% 17% 23% 37% 13%
High 49% 37% 7% 14% 33% 36% 10%
Education Highschool 24% 33% 8% 18% 29% 32% 12%
Some College 13% 24% 6% 13% 27% 44% 10%
BSC+ 63% 44% 10% 14% 29% 36% 11%
Methodology. Fielded October 2025 among 645 registered voters nationwide. Responses weighted by Demographics and Spectrum. Average expected error ±3.9%. See Why trust our polls? for the methodology, disclosures and accuracy record.

Tariffs as Government Revenue

Which of these statements best reflects your opinion on using tariffs as a source of government revenue?

The full crosstab table

ActiVote · Tariffs as Government Revenue · October 20, 2025
ActiVote 616 RV Unweighted Weighted Tariffs as all revenue Tariffs as more revenue Same as today Tariffs as less revenue Eliminate
National ±3.9% MoE 100% 100% 8% 30% 25% 10% 26%
Political Spectrum Left 34% 20% 2% 6% 28% 21% 43%
Moderate Left 30% 20% 2% 13% 30% 14% 41%
Center 16% 20% 4% 29% 34% 6% 27%
Moderate Right 7% 20% 12% 64% 10% 3% 11%
Right 14% 20% 20% 52% 18% 4% 6%
Region rural 38% 31% 2% 42% 15% 8% 32%
suburban 37% 36% 9% 30% 35% 4% 22%
urban 24% 33% 13% 19% 25% 18% 24%
Age 18-29 24% 15% 3% 30% 23% 16% 28%
30-49 44% 33% 9% 25% 27% 13% 27%
50-64 16% 25% 8% 31% 28% 6% 26%
65+ 16% 28% 10% 37% 22% 7% 24%
Gender F 29% 53% 3% 35% 23% 13% 26%
M 71% 47% 14% 26% 28% 7% 26%
Affiliation D 47% 39% 4% 16% 27% 16% 37%
R 30% 32% 9% 54% 24% 4% 9%
I 21% 27% 13% 26% 25% 9% 27%
Ethnicity White 84% 67% 6% 34% 28% 8% 23%
Black 8% 11% 6% 34% 5% 7% 48%
Latino 4% 14% 23% 23% 28% 9% 17%
Income Low 19% 21% 4% 44% 18% 8% 26%
Middle 33% 41% 10% 23% 25% 13% 29%
High 48% 38% 8% 31% 30% 8% 23%
Education Highschool 22% 32% 17% 32% 21% 8% 22%
Some College 13% 23% 0% 36% 30% 9% 25%
BSC+ 64% 44% 6% 26% 26% 13% 29%
Methodology. Fielded October 2025 among 616 registered voters nationwide. Responses weighted by Demographics and Spectrum. Average expected error ±3.9%. See Why trust our polls? for the methodology, disclosures and accuracy record.

Tariffs: Future Direction

Which of the following statements best reflects your opinion on the overall direction the U.S. should take with tariffs?

The full crosstab table

ActiVote · Tariffs: Future Direction · October 20, 2025
ActiVote 612 RV Unweighted Weighted Expand tariffs Expand selectively Maintain tariffs Reduce tariffs Remove tariffs
National ±4.0% MoE 100% 100% 9% 15% 18% 33% 24%
Political Spectrum Left 34% 20% 1% 3% 4% 49% 44%
Moderate Left 30% 20% 1% 7% 7% 44% 40%
Center 16% 20% 6% 20% 15% 38% 21%
Moderate Right 8% 20% 17% 20% 41% 14% 7%
Right 13% 20% 22% 25% 30% 17% 6%
Region rural 38% 31% 9% 12% 28% 25% 26%
suburban 38% 36% 12% 12% 16% 37% 23%
urban 25% 33% 7% 21% 10% 37% 25%
Age 18-29 23% 15% 6% 14% 14% 43% 22%
30-49 44% 32% 8% 15% 17% 36% 23%
50-64 16% 24% 9% 17% 18% 28% 28%
65+ 16% 29% 13% 13% 21% 30% 23%
Gender F 29% 52% 8% 17% 18% 32% 25%
M 71% 48% 11% 13% 18% 35% 23%
Affiliation D 48% 39% 2% 11% 5% 44% 38%
R 30% 32% 17% 23% 32% 21% 7%
I 20% 27% 12% 12% 19% 35% 23%
Ethnicity White 84% 68% 11% 14% 22% 31% 22%
Black 9% 11% 2% 14% 13% 19% 53%
Latino 4% 14% 11% 30% 5% 54% 0%
Income Low 18% 21% 12% 12% 24% 27% 24%
Middle 36% 43% 7% 13% 12% 41% 27%
High 46% 37% 11% 19% 21% 27% 22%
Education Highschool 21% 32% 13% 8% 35% 21% 23%
Some College 14% 24% 7% 12% 13% 47% 21%
BSC+ 66% 44% 8% 22% 8% 34% 27%
Methodology. Fielded October 2025 among 612 registered voters nationwide. Responses weighted by Demographics and Spectrum. Average expected error ±4.0%. See Why trust our polls? for the methodology, disclosures and accuracy record.

Tariffs: Corruption and Lobbying

Which of the following statements best reflects your opinion on corruption and lobbying?

The full crosstab table

ActiVote · Tariffs: Corruption and Lobbying · October 20, 2025
ActiVote 601 RV Unweighted Weighted No problem Not much of a problem Somewhat of a problem Serious Very serious
National ±4.0% MoE 100% 100% 2% 7% 10% 13% 68%
Political Spectrum Left 34% 20% 1% 3% 2% 10% 84%
Moderate Left 30% 20% 1% 2% 4% 11% 81%
Center 16% 20% 6% 8% 6% 16% 65%
Moderate Right 7% 20% 1% 10% 18% 8% 63%
Right 13% 20% 2% 10% 22% 17% 49%
Region rural 37% 31% 5% 12% 16% 14% 53%
suburban 39% 35% 1% 6% 11% 13% 68%
urban 25% 34% 1% 2% 3% 11% 82%
Age 18-29 24% 15% 1% 0% 13% 14% 73%
30-49 42% 31% 4% 11% 10% 14% 61%
50-64 17% 25% 2% 6% 5% 8% 79%
65+ 17% 28% 2% 6% 13% 15% 63%
Gender F 28% 52% 3% 6% 8% 9% 73%
M 72% 48% 2% 7% 12% 17% 62%
Affiliation D 46% 40% 3% 10% 3% 11% 72%
R 31% 31% 2% 8% 14% 12% 64%
I 21% 28% 2% 0% 16% 17% 66%
Ethnicity White 84% 68% 4% 10% 12% 12% 63%
Black 9% 12% 0% 0% 12% 14% 74%
Latino 4% 14% 0% 0% 0% 20% 80%
Income Low 18% 21% 2% 3% 4% 11% 79%
Middle 35% 41% 3% 12% 12% 13% 61%
High 47% 38% 2% 3% 11% 14% 70%
Education Highschool 23% 32% 0% 0% 19% 6% 75%
Some College 14% 24% 0% 0% 10% 20% 70%
BSC+ 63% 45% 5% 15% 4% 14% 63%
Methodology. Fielded October 2025 among 601 registered voters nationwide. Responses weighted by Demographics and Spectrum. Average expected error ±4.0%. See Why trust our polls? for the methodology, disclosures and accuracy record.