
Abortion
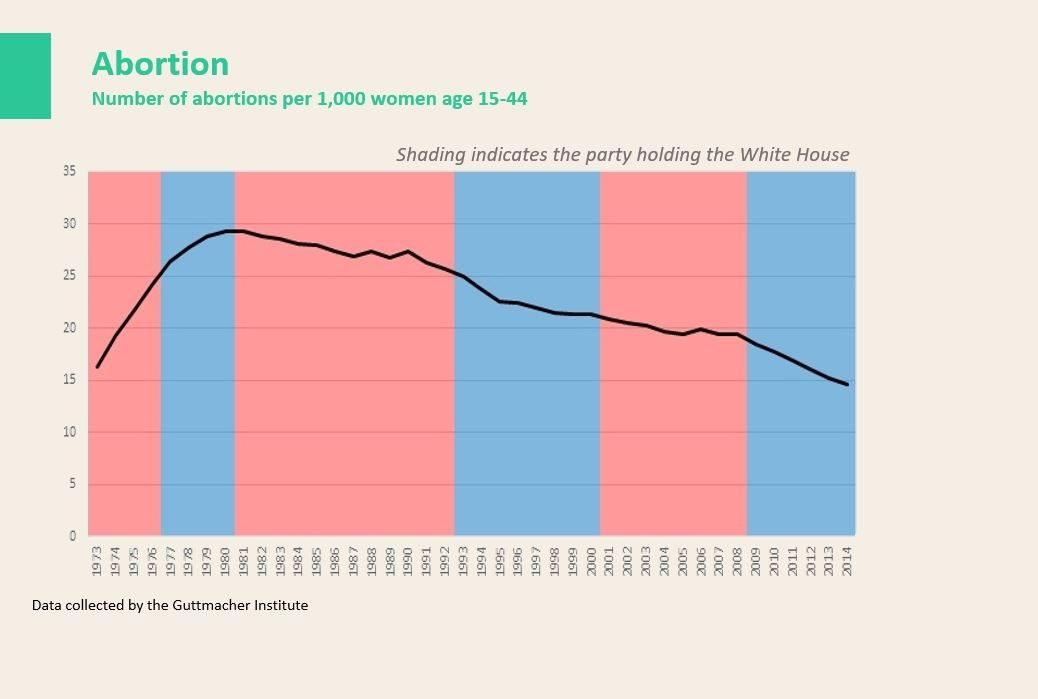
Recently, the Supreme Court announced that they will review the Mississippi abortion law that bans most abortions after 15 weeks of pregnancy, which is significantly before fetal viability, in direct conflict with the 1973 Roe vs. Wade ruling, which allowed abortions in the first six months of pregnancy.
With the Supreme Court’s 6-3 conservative majority, commentators from both sides of the debate believe that the ruling, expected sometime during 2022, could have major implications for reproductive rights in America.
We may have to wait almost a year to find out what the Roberts’ court will decide, but we can find out right now what America thinks about abortion. For that reason we asked over 12,500 users of ActiVote their opinion on abortions, giving them five options to pick from:
- They should be illegal in all cases.
- They should be illegal except in extreme circumstances.
- They should be legal but only until the pregnancy reaches a certain duration (e.g. late in the pregnancy it should be illegal).
- They should be legal in most circumstances, but some regulations surrounding the logistics and time frame of the process (e.g. late-term regulations) should be allowed.
- They should be legal in all cases.
The overall result is that while, as expected, we are clearly divided on the issue, there is some nuance in our opinions: each of the five answers received between 13% and 24% support showing that opinions cover the whole spectrum from “always illegal” to “always legal”.
Overall the country is more “pro-choice” than “pro-life”, with only 1 in 3 (32%) believing that abortion should (almost) always be illegal, while 1 in 2 (48%) believe that it should (almost) always be legal. The middle option, which most closely resembles Roe vs. Wade “legal up to a certain point in the pregnancy” is chosen by 1 in 5 respondents.
We found virtually no gender-gap, and if anything, men are more supportive of abortion rights than women: 51% of men support making abortion (almost) always legal, while only 45% of women take this position, while for both sexes about 3 in 10 oppose (almost) all abortion rights.
Support for abortion rights decrease with age: a significant majority of 58% of the youngest generation (18-29) supports making abortion (almost) always legal, while only 39% of seniors (65+) have that position. Conversely, only 22% of youngsters want to make abortion (almost) always illegal, while 35% of those 65+ and even 41% of those 50-64 wish to virtually outlaw all abortions.
There are some racial disparities, with Whites being almost evenly split on the question: 39% support abortion rights, while 35% oppose and a large group of 26% chooses the “legal early on, illegal later” option. Latinos are similarly evenly split with 42% supportive and 38% opposing abortion rights. Blacks generally are more supportive of abortion rights (49% vs. 26%). Asians stand out as supporting abortion rights with a clear majority of 58% with only 29% opposed.
While the partisan divide is clear from the graph below, it is not as absolute a litmus test as it is sometimes portrayed to be: 2 in 3 Democrats (67%) are in favor of (almost) always allowing abortions, while only 1 in 7 opposes it, with 1 in 5 believing that it should legal early on, and illegal later. Conversely, nearly 2 in 3 Republicans (62%) wish to ban (almost) all abortions with 1 in 5 (21%) supporting abortion rights.
While there is significant fear in pro-choice circles that the Supreme Court may decide that states can ban most or all abortions (which is what pro-life advocates hope for), our poll shows that such a change would go against the wishes of the majority of our country.
If the Justices would take their cues from our poll, they would realize that the country does not support overturning Roe vs. Wade.
For those that argue that it is “old white men” trying to decide what “young women” can do with their bodies, the only surprise may be that it is not just old white men. It is also “old white women”.
The conclusion is that while abortion is deemed one of the most divisive issues in our political landscape, there is a silver lining in that our divisions on this topic are not absolute along partisan lines: there are different voices within both parties.
Maybe Congress should take that as their cue to stop treating abortion as the 3rd rail of politics, not to be touched with a six-foot pool and instead do their legislative job. The alternative, deferring it to nine unelected officials trying to interpret a 230+ year old document that does not contain the word “abortion”, may not lead to an outcome that represents the will of the people.