63% of Americans Disapprove of the Russian Diesel Import Deal
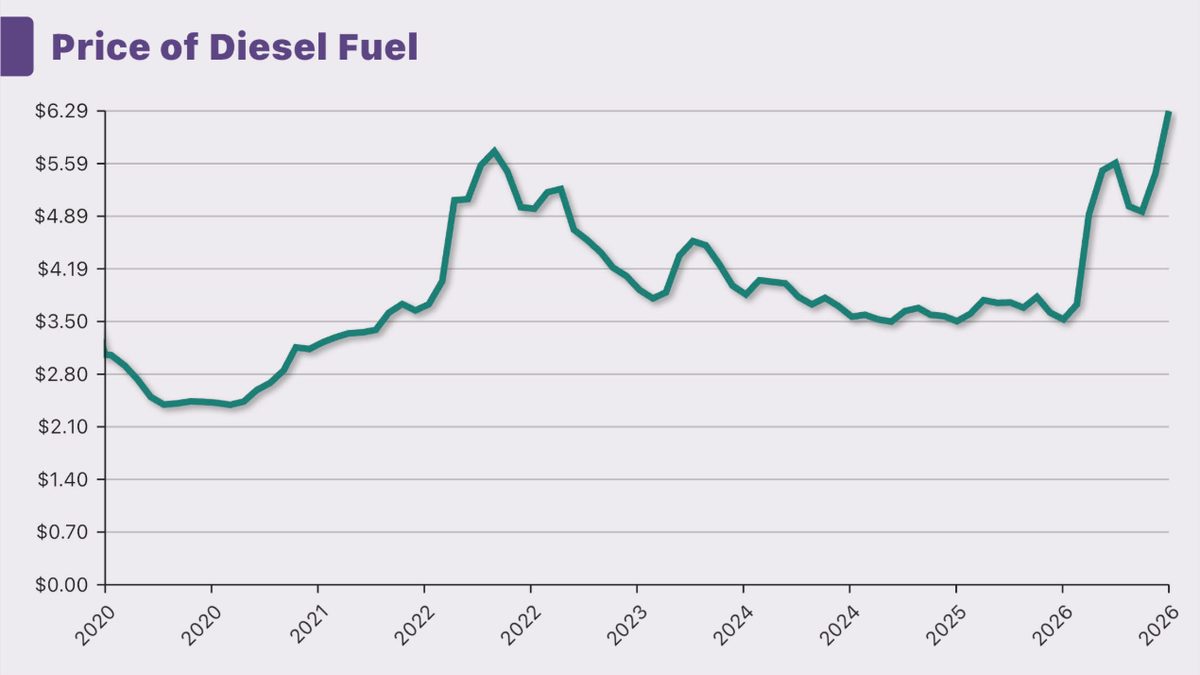
On October 9, 2026, President Donald Trump announced an agreement with Russian President Vladimir Putin to permit Russian diesel imports into the United States by temporarily lifting federal restrictions. Under the agreement, Russia is to supply more than 300,000 tonnes of diesel immediately, an additional 500,000 tonnes in November, and 1,000,000 tonnes after that. The administration had not said which legal mechanism it would use to reconcile the deal with existing restrictions, and on October 10 Representative Brian Fitzpatrick of Pennsylvania began pursuing a discharge petition to force a House vote on legislation that would block it.
The United States restricted Russian energy imports after Russia’s full-scale invasion of Ukraine in 2022. Executive Order 14066 prohibits imports of Russian crude oil, petroleum fuels, liquefied natural gas and coal, and the Ending Importation of Russian Oil Act separately prohibits imports of Russian energy products, though it lets the president end that prohibition after making specified certifications to Congress. On September 18, 2026, Trump signed the Lindsey O. Graham Sanctioning Russia and Iran Act of 2026, which authorizes tariffs of up to 500% on Russian-origin energy goods.
We wondered what Americans think of the deal. So we asked 1,071 registered voters (MoE of 3.0%) from October 12 to October 18, 2026 about it:
Which of the following statements best reflects your opinion on the October 2026 Russian diesel import deal?
- Strongly approve
- Approve
- Neutral
- Disapprove
- Strongly disapprove
What voters said
Most Americans disapprove of the deal. 63% disapprove, and 52% disapprove strongly, which makes strong disapproval the largest single answer by a wide margin. Only 25% approve: 13% strongly approve and 12% approve. Another 11% are neutral, and 2% chose none of the above.
Across the political spectrum
This is a left-right split, but a lopsided one. On the Left, 95% disapprove and 88% disapprove strongly. On the Right, 63% approve. The two sides are not mirror images: disapproval on the Left is nearly unanimous, while on the Right 21% disapprove and another 11% are neutral.
The Center leans firmly against the deal, 68% to 15%. The Moderate Right is the one group that splits down the middle, with 38% approving, 38% disapproving and 22% neutral.
Zooming out
Party affiliation tells the same story. Registered Democrats disapprove 87% to 5%. Independents disapprove 71% to 10%, which puts them much closer to the Democrats than to the middle. Registered Republicans approve 63% to 25%, so a quarter of Republicans are against a deal their own president announced.
Other cuts matter far less. Black voters are the most opposed group by ethnicity, with 70% strongly disapproving. Voters aged 65 and older are the most approving age group, but even among them strong disapproval leads, 48% to 18% for strong approval.
The deal faces a discharge petition in the House aimed at blocking it. Among registered voters, a majority strongly disapproves of the deal, and the Right is the only group on the spectrum where approval wins.
See more of what America thinks in our ongoing polls.