
58% of Americans Want Flock Cameras Removed
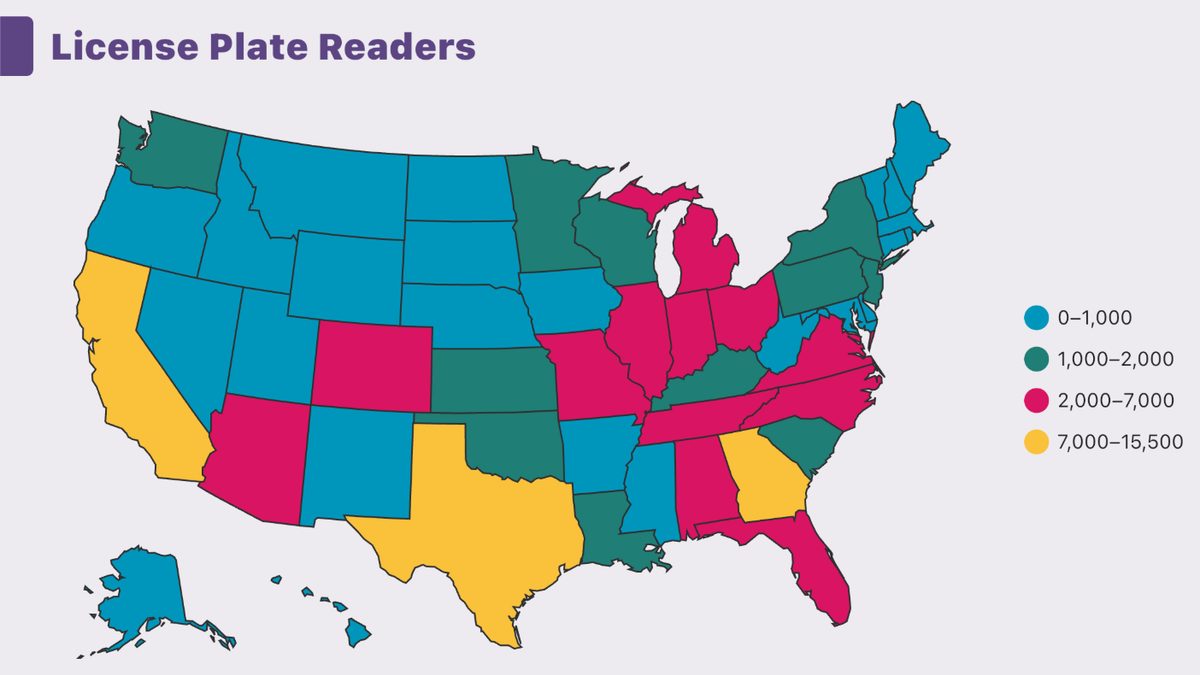
Flock Safety sells automated license plate reader cameras to police departments, communities and businesses. The cameras record plate numbers, dates, times, general locations, directions of travel and vehicle characteristics, and agencies can share those records across jurisdictions. In July the company said its network had passed 120,000 cameras across 49 states, serving more than 6,000 communities.
On August 13, 2026, Flock announced a set of safeguards: a seven-day default retention period in place of thirty days, a requirement that officers attach a criminal case number to every search by the end of the year, mandatory auditing tools that flag unusual search behavior, and automatic lockouts for users whose searches meet undisclosed abuse criteria. The changes followed reported cases of officers using the system for personal purposes, including tracking former partners.
We wondered what Americans think about the trade-off between the public-safety case for these cameras and the privacy case against them. So we asked 937 registered voters (MoE of 3.2%) from September 7 to September 13, 2026 about it:
Which of the following statements best reflects your opinion on public-safety benefits and privacy protections in the use of Flock Safety cameras?
- Prioritize public safety: expand Flock camera deployments
- Favor public safety: maintain current deployments under Flock’s new rules
- Balance safety and privacy: limit use to serious-crime and missing-person cases
- Favor privacy: halt new deployments and phase out existing Flock cameras as contracts expire
- Prioritize privacy: remove existing Flock cameras and prohibit future use
What voters said
This is one of the most lopsided results we have recorded. An outright majority, 58%, chose the strongest privacy answer available: remove the existing cameras and prohibit future use. Another 6% would halt new deployments and phase out the current ones as contracts expire, and 25% would keep the cameras but restrict them to serious-crime and missing-person cases.
That leaves very little on the other side. Just 6% would maintain current deployments under Flock’s new rules, and 4% would expand them. Taken together, 89% of Americans want these cameras limited or gone, against 10% who are content with the status quo or want more. Another 1% selected none of the above.
Across the political spectrum
Unusually, this is not a left-right issue. Removal is the leading answer in every one of the five spectrum groups — 80% on the Left, 59% on the Moderate Left, 56% on the Right, 49% in the Center and 45% on the Moderate Right. The Left is the most emphatic, but the Right is more supportive of removal than either the Center or the Moderate Right.
What separates the groups is the middle option rather than the poles. A third of the Center would limit the cameras to serious crimes, the highest of any group, and support for expanding deployments never rises above 8% anywhere on the spectrum.
Zooming out
Age divides this question far more sharply than politics does. Among voters aged 18 to 29, 74% want the cameras removed, as do 71% of those aged 30 to 49; that falls to 54% of those aged 50 to 64 and 36% of those 65 and older. Education runs the same way: 73% of voters with a high school education want removal, against 30% of those with a bachelor’s degree or more, who are the one group that leans toward restricting the cameras rather than eliminating them.
Flock’s announcement was an attempt to answer the privacy objection while keeping the network in place. These results suggest that the objection is considerably larger than the remedy: the option describing exactly that bargain — keep the cameras, under the new rules — is the least popular answer but one, chosen by 6%.
See more of what America thinks in our ongoing polls.