
50% of Americans Criticize U.S. Control of Venezuelan Oil
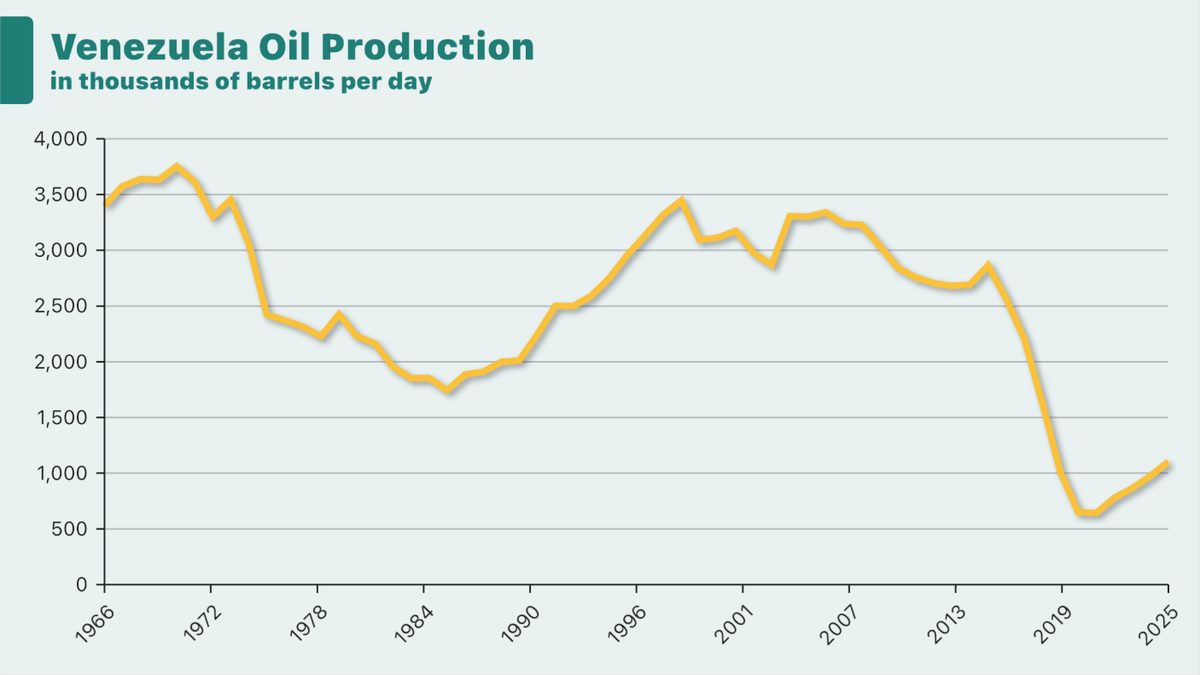
Venezuela has about 303 billion barrels of proven crude oil reserves, but its oil production has fallen sharply amid underinvestment, operational mismanagement, expropriations, and sanctions restricting access to capital, technology, and export markets.
On August 28, President Donald Trump announced an agreement negotiated with Venezuela’s acting president, Delcy Rodríguez. It gives the United States majority control of a joint venture with 100-year operating rights involving 65 billion barrels of proven reserves. The parties had not disclosed key terms, including the oilfields, private operator, payment structure, form of U.S. control, or legal basis for granting the rights.
We wondered what Americans think about the U.S.-Venezuela oil agreement. So we asked 657 registered voters (MoE of 3.8%) from August 31 to September 6, 2026 about it:
Which of the following statements best reflects your opinion on the U.S.-Venezuela oil agreement?
- The agreement is colonial appropriation of Venezuelan resources
- The agreement gives the United States too much control over Venezuelan resources
- The agreement presents comparable sovereignty costs and economic recovery benefits
- The agreement is a beneficial market partnership despite reduced Venezuelan control
- The agreement is U.S.-led market assistance that can restore Venezuela’s oil sector
What voters said
The leading single answer, selected by 39%, was that the agreement is colonial appropriation of Venezuelan resources. Another 27% described it as U.S.-led market assistance that can restore Venezuela’s oil sector.
Taken together, 50% chose the two answers criticizing U.S. control over Venezuelan resources: colonial appropriation or too much control. Meanwhile, 11% called the agreement a beneficial market partnership despite reduced Venezuelan control, 8% said it presents comparable sovereignty costs and economic recovery benefits, and 4% selected none of the above.
Across the political spectrum
Views changed sharply from Left to Right. On the Left, 86% called the agreement colonial appropriation, compared with 7% on the Right. The two answers criticizing U.S. control together drew 96% on the Left, 83% among the Moderate Left, and 13% on the Right.
In the other direction, 59% on the Right and 53% among the Moderate Right described the agreement as U.S.-led market assistance that can restore Venezuela’s oil sector. The Center was much more dispersed: colonial appropriation led with 23%, but no answer received more than a quarter of responses.
Zooming out
The agreement has no single majority interpretation, but the results show that sovereignty and control are central to how it is judged. They also suggest that views of the same U.S. role—as appropriation or as assistance—differ substantially across the political spectrum.
See more of what America thinks in our ongoing polls.