
What does America think of a $15 minimum wage?
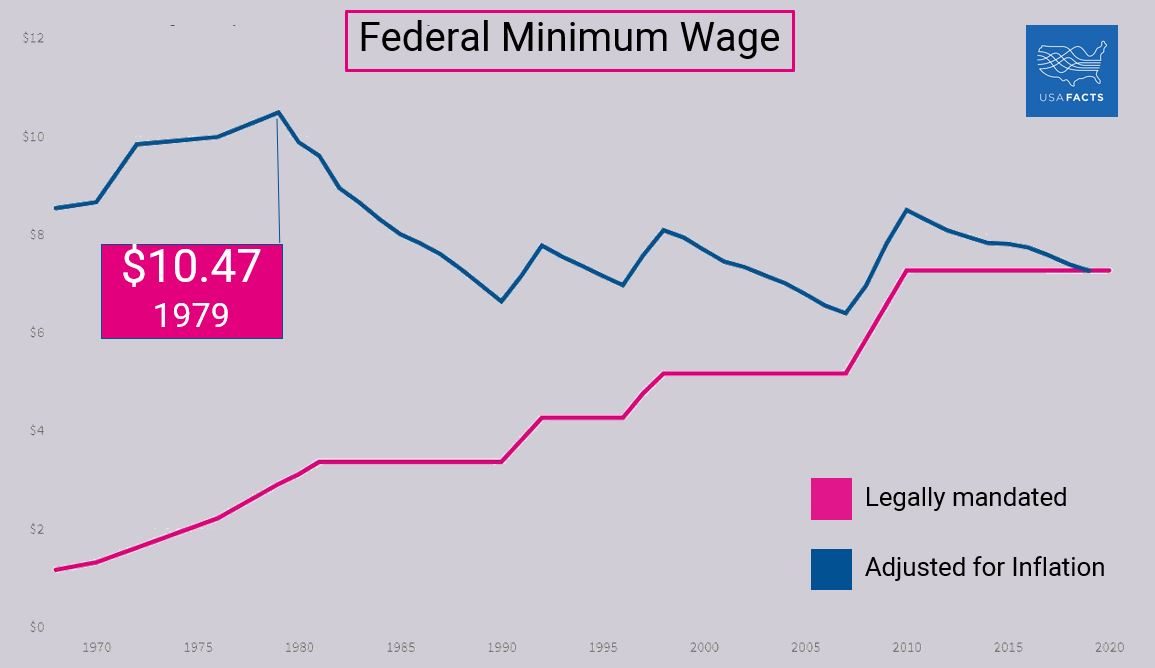
The American Rescue Plan Act, a $1.9 Trillion economic stimulus package that is making its way through Congress, includes in the House version (H.R. 1319) an increase of the Federal Minimum Wage from $7.25 to $15. That increase was scrapped from the Senate version, as it was opposed by all Republicans and eight moderate Democratic senators.
The question is what the American people think, which is why we asked our ActiVote users that question with almost 12,000 voters across the country weighing in.
We gave our users five options to pick from:
- It should be completely handled by the states with no FMW at all.
- It should remain unchanged at $7.25.
- It should be raised to $9.00.
- It should be raised to $11.75.
- It should be raised to $15.00.
The various numbers reflect the current federal minimum wage ($7.25), the inflation-corrected value of the 2009 federal minimum wage ($9.00), the inflation-corrected value of the highest minimum wage in our history ($11.75) and the proposal from the progressive wing of the Democratic party ($15.00).
Nationally, among all our voters, a majority of 69% believe that there should be at least some increase of the minimum wage, while a minority of 40% thinks that the increase should be all the way to $15.00. Maybe this explains why only 42% of senators vote for the increase?
There are some differences of opinion depending on income levels, but the differences are not about the $15 option: among all income groups the support is steady at about 40%. However, while support for an $11.75 minimum wage is at only about 15% among medium and higher income earners, the support is 23% among low income earners.
There is a significant gender bias in the minimum wage discussion: 78% of women support some form of minimum wage increase, while only 61% of men are supportive.
The largest determining factor in the Federal Minimum Wage discussion is party affiliation: a ⅔ majority of Democrats support $15 and almost 90% support any type of increase. On the other hand, the most common opinion (42%) among Republicans is that there should be no Federal Minimum Wage at all, as they believe it should be left to the states. Another 9% does not want to increase the current minimum wage, meaning that Republicans in majority do not support any increase at this time.
Independents, by a ⅔ majority favor an increase to at least $11.75, but also among them there is no majority for the push for $15.
All this tells us that despite the high-profile push for a $15 minimum wage, it is not what the country wants at this time. However, the country does want an increase, to either $9 (supported by 49% of Republicans, 79% of Independents and 89% of Democrats) or $11.75 (34% of Republicans, 66% of Independents and 82% of Democrats), or something in between those numbers.
The Federal Minimum Wage seems to be an example of “Perfect is the enemy of the Good”. Maybe a future bill will have a number between $9 and $11.75 for the Federal Minimum Wage. If it does, it is good to know that it will have significant support around the country and may have a chance to become law.